Reports of 508 Clear search Modify search
Detector Characterisation (Spectral lines)
Tringali, Fiori, Mantovani - 17:15 Friday 10 May 2024 (64223) Print this report
Comment to Sideband structure around the 50 Hz mains line (64000)

Looking at the spectrogram of Hrec since April 1st, we noticed an increase of a sideband noise around the 50 Hz during May 2nd-4th, Figure1 (top). It seems to be correlated to a decrease of accuracy of DIFFp_TX (bottom).

As in #64018, in Figure 2 we observe two couple of sidebands probably due to a beating between the 50 Hz and DIFFp_TX at  ±0.75 Hz and ±0.42 Hz (roughly).

A residual of these sidebands seems often present: purple curve of Figure 2 and spectrogram in Figure 1.

Images attached to this comment
Environmental Monitoring (Environmental Monitoring)
fiori, graziaplena, paoletti, tringali, renato.romero - 17:23 Thursday 09 May 2024 (64217) Print this report
Comment to low frequency magnetic disturbance site-wide (64116)

We performed some measurements with a portable magnetometer: 3-axial magnetic probe FL3 100 Stefan Mayer. 

Figure 1 compares spectra recorded in two locations:

  • "EXTMAG chs X,Y,Z" the probe was placed on the soil nearby the buried external magnetometer
  • "GUARD3 chs X,Y,Z" the probe was on the soil next to the vent tube of the methan gas pipeline, this is located inside the EGO fence next the EGO guardiania, see the attached pictures.

The GUARD3 spectra clearly show the noise: 0.23 Hz spaced lines peaking at 8Hz. The peak amplitude (spectra are obtained with 25s window) is approx 2 nT/sqrtHz. Which is a factor approx 100 larger than measured in the location EXTMAG, but similar to that measured by the magnetometers on the NI and WI tower base. Might be due to telluric currents in the chambers?  

As a check of the probe calibration, in Figures 2 and 3 we compare the EXTMAG measurement with that of the buried magnetometer, ENV_EXT_MAG_N. The fluxgate probe is more noisy (intrinsic noise) but around 8Hz they are measuring the same.

The indication is that the magnetic disturbance is radiated from the methan gas pipelines. A noise clearly associated to the power supply for galvanic currents in these pipelines was observed in the year 2022 (55542 and 57973). At that time the noise was shaped as approx. 5Hz comb. 

Federico has contacted the methan gas company (SNAM) to investigate further the source.

Images attached to this comment
Detector Characterisation (Broadband noise)
bersanetti, tringali - 18:15 Monday 06 May 2024 (64181) Print this report
Another flyover at CEB

Today at 13:00 LT we could see an airplane flying over the main building, probably just departed from the lane nearby; one minute later it can be spotted in the CEB microphone signals, but it did not have an impact on Hrec; some 25 minutes later it probably came back along the same route, luckily causing no effect again on the sensitivity.

Images attached to this report
Detector Characterisation (Glitches)
fiori, tringali - 10:09 Monday 29 April 2024 (64128) Print this report
Comment to New numerous glitches starting last night (64114)

Glitches disappeared around 6:45 UTC. Has some action been taken? Indeed, square waves were seen also in the CEB UPS CURR T monitor, as for the old problem with WI heating belts that Bas pointed out.

Images attached to this comment
Environmental Monitoring (Environmental Monitoring)
fiori, paoletti, renato.romero, tringali, direnzo - 19:52 Saturday 27 April 2024 (64116) Print this report
low frequency magnetic disturbance site-wide

A new noise is seen in the external magnetometer starting April 22 19:56 UTC. Figures 1 and 2. The noise has been detected and studied by Renato and Federico. Here is a report of the investigation so far.

The noise is impulsive, as seen in Figures 3,4,5. Observed in the time domain it consists of a carrier at about 8Hz switching on-off with a cycle of approximately 4.4s (0.23 Hz): on for 2.2s and off for 2.2s.

The noise is seen by all magnetometers site-wide. Internal magnetometers sees it a factor up to about 10 larger than the external "N" magnetometer, in Figure 6 and Figure 7 (the EXT_N magnetometer is the gray spectrum in all 3 plots). Magnetometers that see it a bit more intense are those close to NI, WI and WE towers.

A close look to the narrow spectral structure of the noise shows that it does not follow the mains, in Figure 8.

These hints suggest a DC-powered PWM source (Federico).

Bruco runs using ENV_NI_MAG_V as target, and EXCLUDING all magnetometers (ENV_*MAG*) channels, show that this disturbance is not coherent with any other ENV channel (https://scientists.virgo-gw.eu/DataAnalysis/DetCharDev/bruco/users/fiori/ENV_NI_MAG_V_1397853318_ENV/) with the exception of a small coherence with the ENV_CEB_ELECTRIC. In particular no coherence, nor evidence of the noise is seen in all IPS and UPS probes. No coherence is also measured with any other Virgo signal (https://scientists.virgo-gw.eu/DataAnalysis/DetCharDev/bruco/users/fiori/ENV_NI_MAG_V_1397853318/). While s is a good news for the interferometer, it does not help much locating the source.

Measurements will be done also to check for possible external sources, like it was for galvanic currents in the natural gas pipelines (https://logbook.virgo-gw.eu/virgo/?r=55542).

Images attached to this report
Comments to this report:
fiori, graziaplena, paoletti, tringali, renato.romero - 17:23 Thursday 09 May 2024 (64217) Print this report

We performed some measurements with a portable magnetometer: 3-axial magnetic probe FL3 100 Stefan Mayer. 

Figure 1 compares spectra recorded in two locations:

  • "EXTMAG chs X,Y,Z" the probe was placed on the soil nearby the buried external magnetometer
  • "GUARD3 chs X,Y,Z" the probe was on the soil next to the vent tube of the methan gas pipeline, this is located inside the EGO fence next the EGO guardiania, see the attached pictures.

The GUARD3 spectra clearly show the noise: 0.23 Hz spaced lines peaking at 8Hz. The peak amplitude (spectra are obtained with 25s window) is approx 2 nT/sqrtHz. Which is a factor approx 100 larger than measured in the location EXTMAG, but similar to that measured by the magnetometers on the NI and WI tower base. Might be due to telluric currents in the chambers?  

As a check of the probe calibration, in Figures 2 and 3 we compare the EXTMAG measurement with that of the buried magnetometer, ENV_EXT_MAG_N. The fluxgate probe is more noisy (intrinsic noise) but around 8Hz they are measuring the same.

The indication is that the magnetic disturbance is radiated from the methan gas pipelines. A noise clearly associated to the power supply for galvanic currents in these pipelines was observed in the year 2022 (55542 and 57973). At that time the noise was shaped as approx. 5Hz comb. 

Federico has contacted the methan gas company (SNAM) to investigate further the source.

Images attached to this comment
Environmental Monitoring (Environmental Monitoring)
fiori, paoletti, tringali, derosa - 9:23 Saturday 27 April 2024 (64115) Print this report
MCB magnetometer faulty

As observed by Federico, the metronix magnetometer in MCB is having an issue starting from 2023 October 2 UTC 00:03:03 (Figure 1). The signal looks corrupted (Figure 2).  This does not seem an issue with the ADC and neither with the driving electronics, since other channels sharing the same boards are fine. We will investigate further at next maintenance.

This fauty condition was not signalled by the DMS DeadChannel since the associated rms was smaller than the set threshold. The rms threshold has been updated (0.35 to 1 nT) and this channel temporary shelved.

Images attached to this report
Environmental Monitoring (Environmental Monitoring)
Paoletti, Fiori, Tringali. - 15:18 Sunday 21 April 2024 (64048) Print this report
Comment to Test of automated injections using ENV_MAIN (63714)
Images attached to this comment
Environmental Monitoring (Environmental Monitoring)
Paoletti, Fiori, Tringali - 18:02 Friday 19 April 2024 (64032) Print this report
Comment to Test of automated injections using ENV_MAIN (63714)

We tested the sensitivity of the top-stage BS accelerometers at three different levels of acoustic injection (nominally 0.03 - 0.04 - 0.05 V).

Noise was filtered from 8 to 2000 Hz, but the actual noise produced was only from 20 Hz and up, as the speaker is unable to go lower.


The fourth injection (18:04:40 UTC - (80 -100) Hz, 300 sec, 0.04 V) aimed to produce the same level around the frequency of ~93 Hz (without generating out-of-band noise) where one of the horizontal BS F0 accelerometers (Sa_BS_F0_ACC_H3_500Hz) is usually excited during acoustic injections, in order to check whether the coupling is linear or not.

Unfortunately, the filter was too narrow, and the noise spectral density at 93 Hz was lower than expected.

However, we can say that generating a higher level by a factor of 2 (with no noise at lower frequencies) resulted in an increase of the peak by about a factor of 2 (difficult to estimate accurately). It appears that there is no upconversion and the system is "linear."


During this test we also noticed that there is some (unexplained) coherence between the upper stage F0 accelerometers and the lower external magnetometers (this is also the case in other towers besides BS).

At first glance one might think of general coupling due to the external accelerometer cables running not too far from the magnetometers (as indeed they are), but there are high-level signals in the acceleration spectrum that have no coherence. If it were a coupling from the cable, it should be broadband.

Images attached to this comment
Environmental Monitoring (Environmental Monitoring)
Fiori, Paoletti, Tringali - 20:14 Thursday 18 April 2024 (64024) Print this report
Comment to Test of automated injections using ENV_MAIN (63714)

We performed a set of four acoustic injections in CEB with the AcousticInjectionCEB VPM process:

1) 17:07:55 UTC - (8 - 2000) Hz, 600 sec, 0.03 V

2) 17:21:05 UTC - (8 - 2000) Hz, 600 sec, 0.04 V  (25 min glitch at ~17:29:24 UTC)

3) 17:33:48 UTC - (8 - 2000 )Hz, 600 sec, 0.05 V

4) 18:04:40 UTC - (80 -100) Hz, 300 sec, 0.04 V

The directory path of output files is /virgoData/NoiseInjections/AcousticInjectionsO4/output. The list of file injections is reported below:

1) AcousticColored_NOISE_CEB_DetTerrace-1397495261.txt

2) AcousticColored_NOISE_CEB_DetTerrace-1397496052.txt

3) AcousticColored_NOISE_CEB_DetTerrace-1397496814.txt

4) AcousticColored_NOISE_CEB_DetTerrace-1397498666.txt

Detector Characterisation (Spectral lines)
Tringali, Spinicelli, Fiori - 18:11 Thursday 18 April 2024 (64018) Print this report
Comment to Sideband structure around the 50 Hz mains line (64000)

As Piernicola confirmed, the sidebands at 46.7 Hz and 53.3 Hz are the beating between 50 Hz and DIFFp_TX line at 3.3 Hz (purple curve).
Indeed, when the DIFFp_TX line was set to 4.8 Hz, there were two sidebands at 45.2 Hz and 54.8 Hz, respectively (blue curve).

Images attached to this comment
Detector Characterisation (Spectral lines)
Tringali, Fiori - 14:44 Thursday 18 April 2024 (64013) Print this report
Line at 47.5 Hz

Looking at the spectrogram of Hrec, we observed a peak at 47.5 Hz which arose on April 15th, ~01:00 UTC (between two locks), see Figure 1 and 2.
It could be related to the F7 crossbar mode of the NI tower that we measured by magnetic injections to be at 47.65 Hz (VIR-0300A-24).
In this case, it seems that the line has shifted slightly in frequency.

Images attached to this report
Detector Characterisation (Spectral lines)
direnzo, tringali - 15:12 Wednesday 17 April 2024 (64000) Print this report
Sideband structure around the 50 Hz mains line

Continuing the investigation of the spectral noise on the first week of O4b data, we found an interesting structure of "wandering sidebands" around the 50 Hz line. (S

Figure 1 shows the spectrogram in the region 42-58 Hz around the frequency of the electric mains. Two pairs of wandering sidebands are visible at 44 (Figure 2) and 56 Hz, and at 46.7 (Figure 3) and 53.3 Hz (Figure 5).

The oscillations in frequency, especially those of the 44 and 56 Hz lines, are the same as those of the 50 Hz line (Figure 4) but enlarged by many (~20) times: ~0.50 Hz vs ~0.025 Hz

Additionally, taking advantage of a couple of glitches present in the analyzed data period (the vertical lines), we notice that the 44 and 47.3 Hz lines are synchronous with the 50 Hz line. Also, the 53.3 Hz line seems to have the same phase, while the one at 56 Hz is flipped vertically: Figure 5.

The search for bilinear couplings with MONET highlighted that the 46.7 and 53.3 Hz sidebands are produced by the modulation of the mains line (ENV_CEB_UPS_VOLT_R_2000Hz) and the ASC_DIFFp_T{X,Y} angular control channels: Figure 6 and text file.

A barely negligible coherence has been found for the lines at 44 and 56 Hz; just a 0.1 with SDB1_LC_TX at 56 Hz: Figure 7. This could be a consequence of the large variations in the frequency of the line, which dilute the cohere over multiple frequency bins and, averaged gets small.

Of course, the same structure is present around the other harmonics of the 50 Hz line.

Images attached to this report
Non-image files attached to this report
Comments to this report:
Tringali, Spinicelli, Fiori - 18:11 Thursday 18 April 2024 (64018) Print this report

As Piernicola confirmed, the sidebands at 46.7 Hz and 53.3 Hz are the beating between 50 Hz and DIFFp_TX line at 3.3 Hz (purple curve).
Indeed, when the DIFFp_TX line was set to 4.8 Hz, there were two sidebands at 45.2 Hz and 54.8 Hz, respectively (blue curve).

Images attached to this comment
direnzo - 18:33 Friday 19 April 2024 (64035) Print this report

ERRATA CORRIGE: the sidebands at 44 and 56 Hz are non-physical. These are just an aliasing artefact, consequence of an improper chunk-by-chunk downsampling to produce the resulting spectrogram.

Figure 1: fixed version of the spectrogram in the range 42-58 Hz.

Figure 2: animated GIF that compares the correct spectrogram and the wrong one in the main entry.

Images attached to this comment
direnzo - 16:30 Friday 10 May 2024 (64225) Print this report

The 50 Hz sidebands at \pm0.75 Hz are modelled by the bilinear coupling of ENV_CEB_UPS_VOLT_R_2000Hz and ASC_DIFFp_TX, as visible in the daily MONET results of May 2. The modulator ASC_COMMp_TX produces interesting structures too, although just below the default coherence threshold set on the daily MONET analysis.

Images attached to this comment
Tringali, Fiori, Mantovani - 17:15 Friday 10 May 2024 (64223) Print this report

Looking at the spectrogram of Hrec since April 1st, we noticed an increase of a sideband noise around the 50 Hz during May 2nd-4th, Figure1 (top). It seems to be correlated to a decrease of accuracy of DIFFp_TX (bottom).

As in #64018, in Figure 2 we observe two couple of sidebands probably due to a beating between the 50 Hz and DIFFp_TX at  ±0.75 Hz and ±0.42 Hz (roughly).

A residual of these sidebands seems often present: purple curve of Figure 2 and spectrogram in Figure 1.

Images attached to this comment
Environmental Monitoring (Environmental Monitoring)
fiori, tringali, ruggi - 23:26 Monday 15 April 2024 (63972) Print this report
Comment to Test of automated injections using ENV_MAIN (63714)

On April 9 we performed a set of short (60s) colored acoustic injections in the CEB. The ITF was locked in LOWNOISE 3 since a few minutes.

The purpose was to tune the level of the injection in such a way to avoid triggering the 92 Hz oscillation of the BS F0 accelerometers (mostly Sa_BS_F0_ACC_H3) which caused unlocks in the past (https://logbook.virgo-gw.eu/virgo/?r=63709). The purpose of the present test was not to understand the nature and physical reason of the oscillation onset, which remains to be understood.

We injected colored noise between 20 and 2000Hz with 3 levels: 0.03 V, 0.04 V and 0.05 V, one 25min glitch occurred right at the beginning of the 0.05 V injection (Figure 1).

The intensity on the acoustic noise produced in the hall, measured in the position of the hall microphone, was of the order of a factor 20 above the quiet condition (Figure 2). The 92 Hz oscillation of  the BS F0 ACC H3 accelerometer onsets already with the 0.03 V but  amplifies x5 and x10 when the injected level increases from 0.03V to 0.04V and from 0.03V to 0.05V, respectively (Figure 3).

Figure 4 shows the impact on hrec. The noise in hrec increased at some structures, mostly known to be associated to SDB1. These excitations are well visible with all injected levels (Figure 5, which also shows the 25min glitch).

It seems to notice also an increase of the 74 Hz line (DARM loop gain) and the 227 Hz line (SSFS loop gain). As well, it seems to notice a small increase of the noise in the bucket. It seems that particularly the injection at 0.05 V, brings the ITF to a different working point where other noises (e.g. frequency noise) are more coupled.

However, spectrograms in Figures 6 and 7 indicate that the amplitude of 74 Hz and 227 Hz lines was not so stable during the injection period (we were at the beginning of a lock) and its correlation with single acoustic injections is not straightforward.

Paolo's suggestion is to better study this behaviour with longer injections.

Images attached to this comment
Environmental Monitoring (Environmental Monitoring)
fiori, tringali, paoletti, masserot - 18:28 Monday 15 April 2024 (63970) Print this report
Comment to Test of automated injections using ENV_MAIN (63714)

The issue with the extra spike at the beginning of the colored noise injection was related to time settings in the ACL commands in the ENVnoise process. These modifications were made by Alain (on March 26):

OLD
# commamd - name of output channel - units - output sampling frequency - duration of 0 to 1 transition (s) - duration of 1 to 0 transition (s) - state of transition at startup (see ACL manual)
ACL_RELAY_CH                noise_filter_enbl    "au"    SAMP_FREQ    10    1    1  : the bold 1 means that the relay is equal to 1 at the starting time
# nameOut - unit - rampTime - samplingFreq - density - seed
ACL_NOISE_CH                noise_white            "V"     5    SAMP_FREQ    0.1    : idem the amplitude of the noise at starting time is set to 0.1
NEW
# commamd - name of output channel - units - output sampling frequency - duration of 0 to 1 transition (s) - duration of 1 to 0 transition (s) - state of transition at startup (see ACL manual)
ACL_RELAY_CH                noise_filter_enbl    "au"    SAMP_FREQ    10    1    0 :  relay set to 0 at starting time
# nameOut - unit - rampTime - samplingFreq - density - seed
ACL_NOISE_CH                noise_white            "V"     5    SAMP_FREQ    0.0   : noise amplitude set to 0 too

Figure 1 shows the result of the test: blue is with the OLD settings, purple is the with the NEW settings (the same colored noise with amplitude 0.025 V has been injected in both cases). The spike is no longer present.

The same test was done by injecting the colored noise from the ENVnoise and also using the ENV_MAIN node which calls the AcousticInjectionCEB process.

Images attached to this comment
Detector Characterisation (Broadband noise)
fiori, tringali, paoletti - 16:59 Friday 12 April 2024 (63950) Print this report
Comment to Electric noise coupling to h(t) (63944)

The increased coherence with ENV_NEB_IPS_CURR seems associated to the accidental presence of a glitch in hrec (one of the 25-min glitches) and a glitch in the ENV_NEB_IPS_CURR sensors.

The two glitches are NOT coincident indeed but a few sec away (the IPS glitch occurs after), but they both fall in the 10s window of the Bruco computation.

Figure 1: coherences are computed 120s before the glitch (purple) and in a 120s window containing the glitches.

Figure 2: spectrograms show that the two glitches are a few seconds away. The COHETIME plot implemented in dataDisplay measures a sort of "anti-coherence" (the coherence goes to a lower value in the time window that contains both glitches).

It is not clear what is peculiar to the NEB_IPS_CURR sensor glitch to produce coherence with Hrec?

Images attached to this comment
Detector Operation (DMS)
fiori, tringali, berni, arnaud - 14:03 Tuesday 09 April 2024 (63900) Print this report
DMS threshold tuning for a few ENV channels

Today we have concluded the tuning of DMS threshold for a few ENV channels which have been observed to fluctuate between green and red inside the DeadChannel monitor.

  • ENV_EQB2_ACC_Y,  old value 1E-4.   ----> new value 1E-5
  • ENV_EQB2_MIC,  old value 6.5E-3  ----> new value 1E-4
  • ENV_IB_CT_FINGER_ACC_Y, old value 1.5E-3 ---> new value 1E-4

In particual for channel ENV_IB_CT_FINGER_ACC_Y we had to first fix the issue with too large 50 Hz and harmonics. The same problem was obseved in the past 62620 and fixed by replacing the BNC to lemo adaptor. Figure 1 shows the spectrum of the accelerometer powered off (blue) with the old connector, and Figure 2 shows the same with the new connector.  Figure 3 shows the procedure followed for setting threshold for the sensor ENV_IB_CT_FINGER_ACC_Y.

Images attached to this report
Environmental Monitoring (Environmental Monitoring)
Paoletti, Fiori, Tringali - 14:51 Sunday 07 April 2024 (63873) Print this report
LargeCoil_CEB unrensponsive, with power set ON

On Friday afternoon, while checking the power supply of some accelerometers on the DET terrace, we noticed that the flashing yellow light of the LargeCoil was ON. Indeed, the power amplifier was ON (but without any signal sent from the DAC).

Trying to turn it OFF via the Process Online Monitoring page, we found the LargeCoil_CEB gray (NEB and WEB were correctly green). The process could not be restarted. The box remained gray and the relay powering the amplifier remained in the "1" state.

Today I tried again from remote and the process restarted. I turned off all the relays at 10:51:10 UTC - There is a huge spike on the monitoring channels (ENV_CEB_MAG_COIL_CURR_MON and ENV_CEB_MAG_COIL_VOLT_MON), but it is a fake signal due to the fact that these signals are coming from the power amplifier that turned off (nothing is visible in the CEB magnetometers and in Hrec).

We will check the system again during commissioning (Monday afternoon), also because it seems that the status of the relays visible to the right of the green box is always zero, even though they are (really) set to 1.

Images attached to this report
Environmental Monitoring (Environmental Monitoring)
derossi, spinicelli, tringali - 13:10 Thursday 04 April 2024 (63838) Print this report
Comment to Shaker installation on laser bench (63577)

On the March 12th, a shaker has been installed on the Laser Bench to perform sismic noise injection. After those studies done on the 14th, the electronics that controls the shaker (deployed on the ground) has been left ON (with 0V of input voltage) to have the possibility to further perform other remote injections. 
However, entering in the laser lab few days later, we noticed a slightly higher acoustic noise than usual. We decided then to switch OFF that electronics, and indeed the noise reduced.

Looking at the environmental sensors present in laser lab, we found this noise visible as both high frequency broad noise (>200Hz)  and with some lines a low frequency (~45Hz and harmonics).
Moreover, we see it on acoustic (see fig. 1-3, 5) and sismic (fig. 4) sensors. While the noise is visible on both benches, the effect (seismic and acoustic) on EIB is really faint (see fig 4-5).

Nevertheless, we didn't find any noticeble effect on Hrec.  

Images attached to this comment
Detector Characterisation (Broadband noise)
fiori, spinicelli, tringali - 13:29 Tuesday 26 March 2024 (63741) Print this report
noise in tonight lock

Extra hrec noises were present during tonight locks (Figures 1 and 2):

  • a broadband noise up to 100Hz
  • a bump around 43 Hz

We do not know it the two are related.

Investigating we found that the PSTAB0 line at 43 Hz is injected. and it is seen in various INJ signals (Figure 3).

The plan is to try to switch it off after locking and check the impack on hrec.

Images attached to this report
Comments to this report:
spinicelli - 15:58 Tuesday 26 March 2024 (63744) Print this report

PSTAB0 line (43Hz) has been switched off (amp=0) at 12.52.40UTC.

We could then relock in LN3: the bump at 43 disappeared while the broadband noise was still there.

To be noted that PSTAB1 line (236Hz) is still injected while, as far as I know, not used by any loop.

mwas - 18:15 Tuesday 26 March 2024 (63746) Print this report

I have been able to run the noise budget by hand, after changing some of the Pcal channels used that have disappeared in the last two days from the raw data.

Figure 1. Shows that the noise budget thinks the OMC projection is high. Normally it is 2 orders of magnitude below the sensitivity curve.

Figure 2 shows that the OMC error signal spectrum is 3 orders of magnitude higher than usual. The sensing noise is three orders of magnitude higher.

Figure 3. In the lock of ~17:00 UTC the problem is no longer present. Maybe the issue was removed by the restart of the SDB1_OMC process that was done today by Alain around 15:00 UTC.

Images attached to this comment
gouaty, masserot - 19:00 Tuesday 26 March 2024 (63749) Print this report

The issue was due to the release v1r22p17 of Acl . A Cm command  related to the ACL_SUM_CH  object use to select the error signal was not applied .

Below the messages from the SDB1_OMC logfile

2024-03-25-23h01m05-UTC>WARNING-AcSumChCmSet> OMC1_in1 - missing arguments: cmType "AcSumChSet" -t -d -d -t ... - rtn -1
2024-03-25-23h01m05-UTC>WARNING-AcSumChCmSet> OMC1_in0d5 - missing arguments: cmType "AcSumChSet" -t -d -d -t ... - rtn -1

As a result , the error was not the expected one and as consequence a large correction signal.

direnzo - 19:02 Tuesday 26 March 2024 (63747) Print this report

The large broadband noise up to some hundred Hz is highly coherent between Hrec and V1:DET_B1_DC, as a result of a dedicated BruCo run: link (I'm currently rerunning the script to fix the cropped y-scale). In the table, you can find also a bunch of channels coherent with the large peak at 43 Hz.

Figure 1: coherence and noise projection of V1:DET_B1_DC to Hrec.

Images attached to this comment
direnzo - 8:18 Wednesday 27 March 2024 (63752) Print this report

[For some reason, this message has remained in the Drafts, even if I received the notification that it was added to the Logbook...]

Ignore my previous entry. The highlighted channel is one of those recently added to DET, as reported in this logbook entry: #63738. I'm adding them to the excluded channels from BruCo analysis:

/data/dev/detchar/online/bruco/share/virgo_excluded_channels_Hrec_hoft.txt

EDIT: BruCo daily results for Hrec (link) have correctly excluded this channel from the analysis. Unfortunately, I forgot to edit the corresponding list for DARM, and the coherence results for the last day (link) have been dominated by the new DET channel: ignore this channel from the BruCo results.

Now, I have edited the excluded channel list for DARM too. I've opened this git issue to keep track of the various excluded channel lists and keep them up to date.

Environmental Monitoring (Environmental Monitoring)
fiori, tringali, Paoletti - 19:50 Saturday 23 March 2024 (63714) Print this report
Test of automated injections using ENV_MAIN

This is a follow up of https://logbook.virgo-gw.eu/virgo/?r=63649

Friday afternoon we used two hours of commissioning to test the ENV_MAIN metratron node. The ITF was locked in LOW_NOISE_3_SQZ, COMMISSIONING.

WE performed this sequence of environmental injections:

  • magnetic injection far field in CEB with the wall coil: 300s, sweep 8 Hz to 1000 Hz, 9V to the DAC
  • magnetic injection far field in NEB with the wall coil: 300s, sweep 8 Hz to 1000 Hz, 9V
  • magnetic injection far field in WEB with the wall coil: 300s, sweep 8 Hz to 1000 Hz, 9V
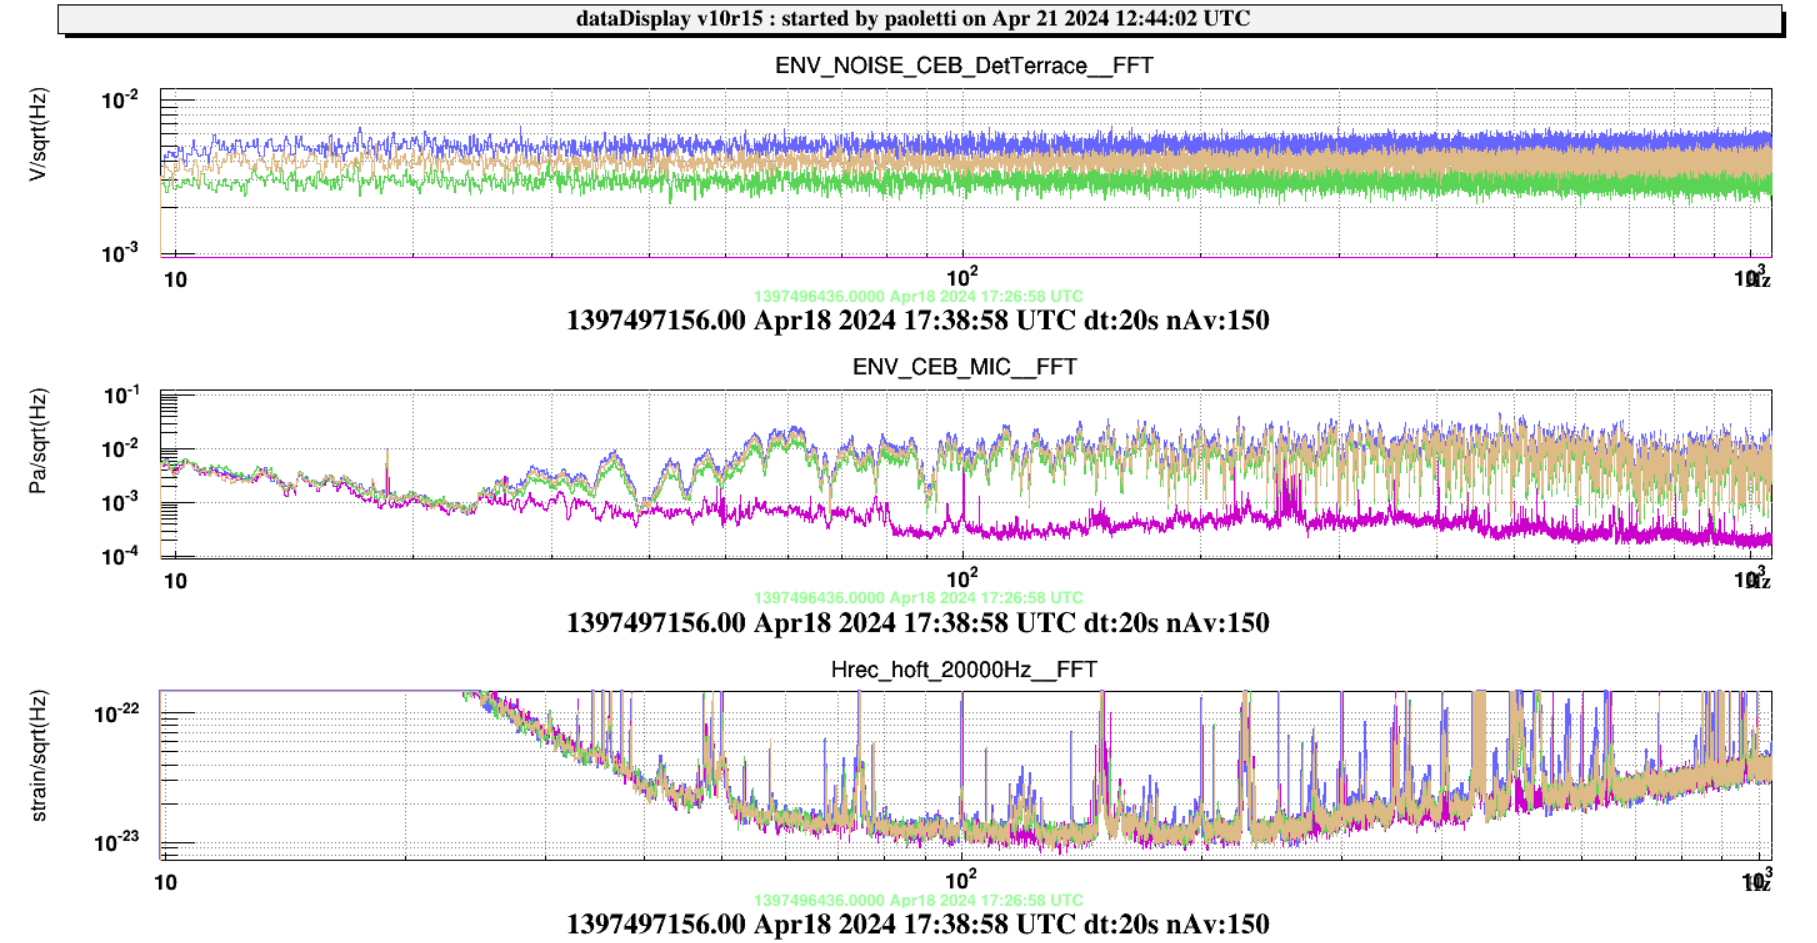
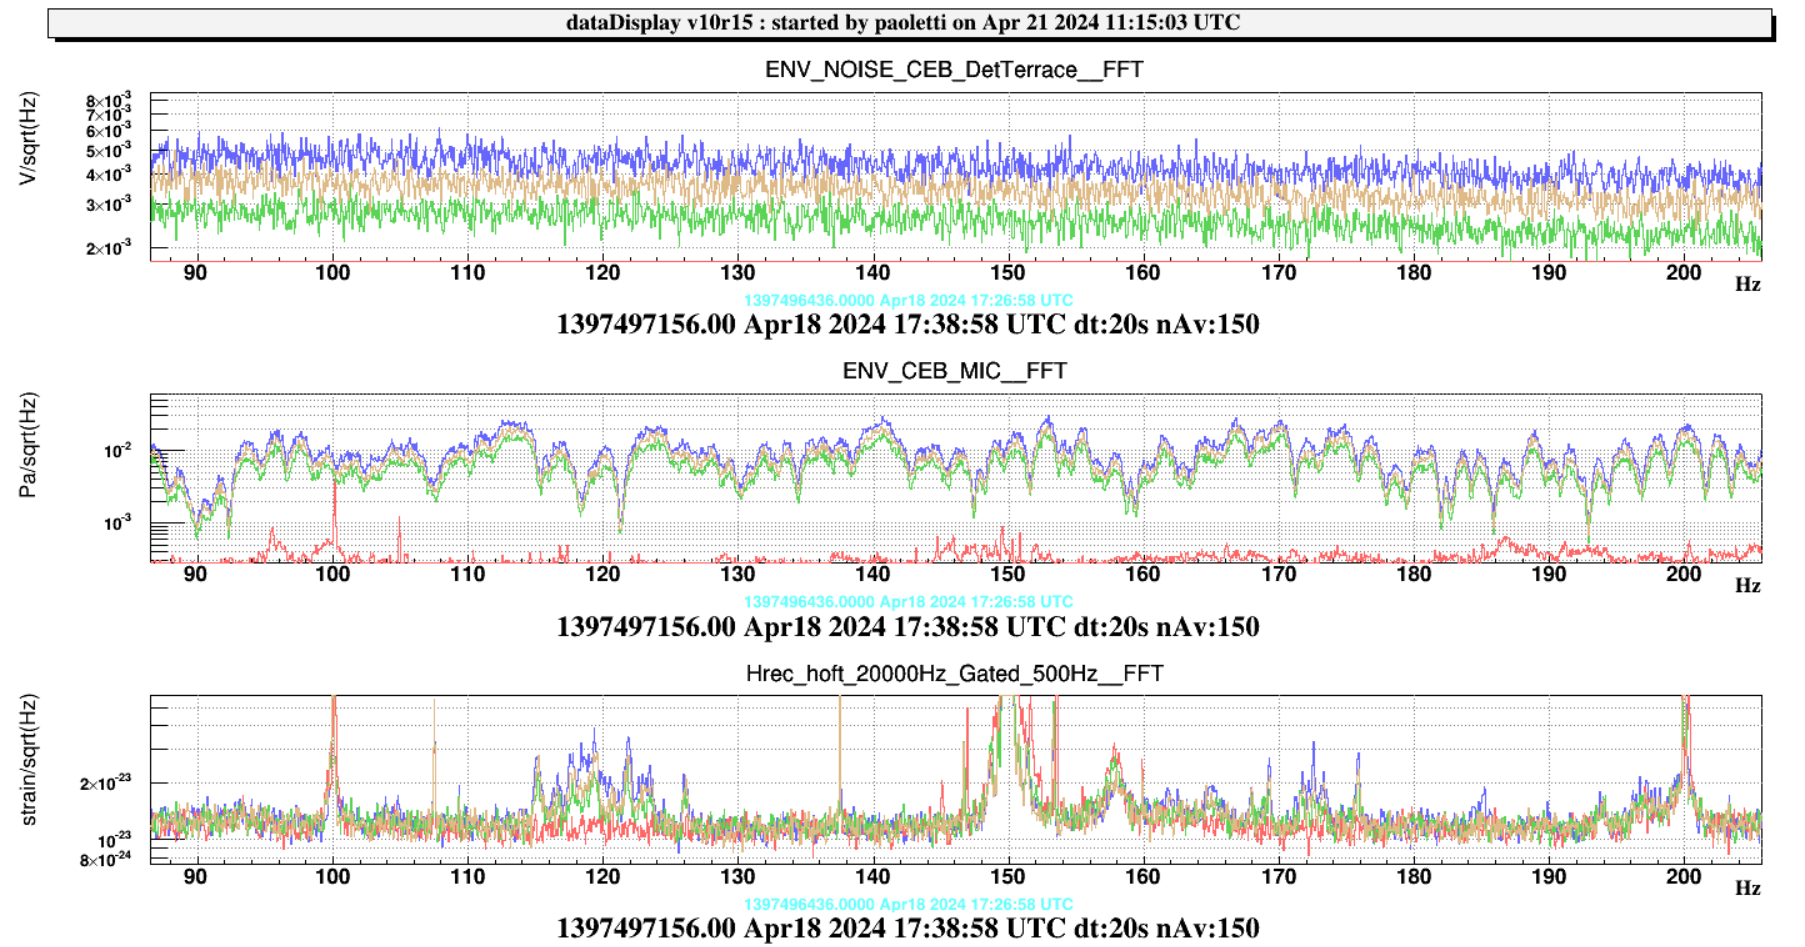
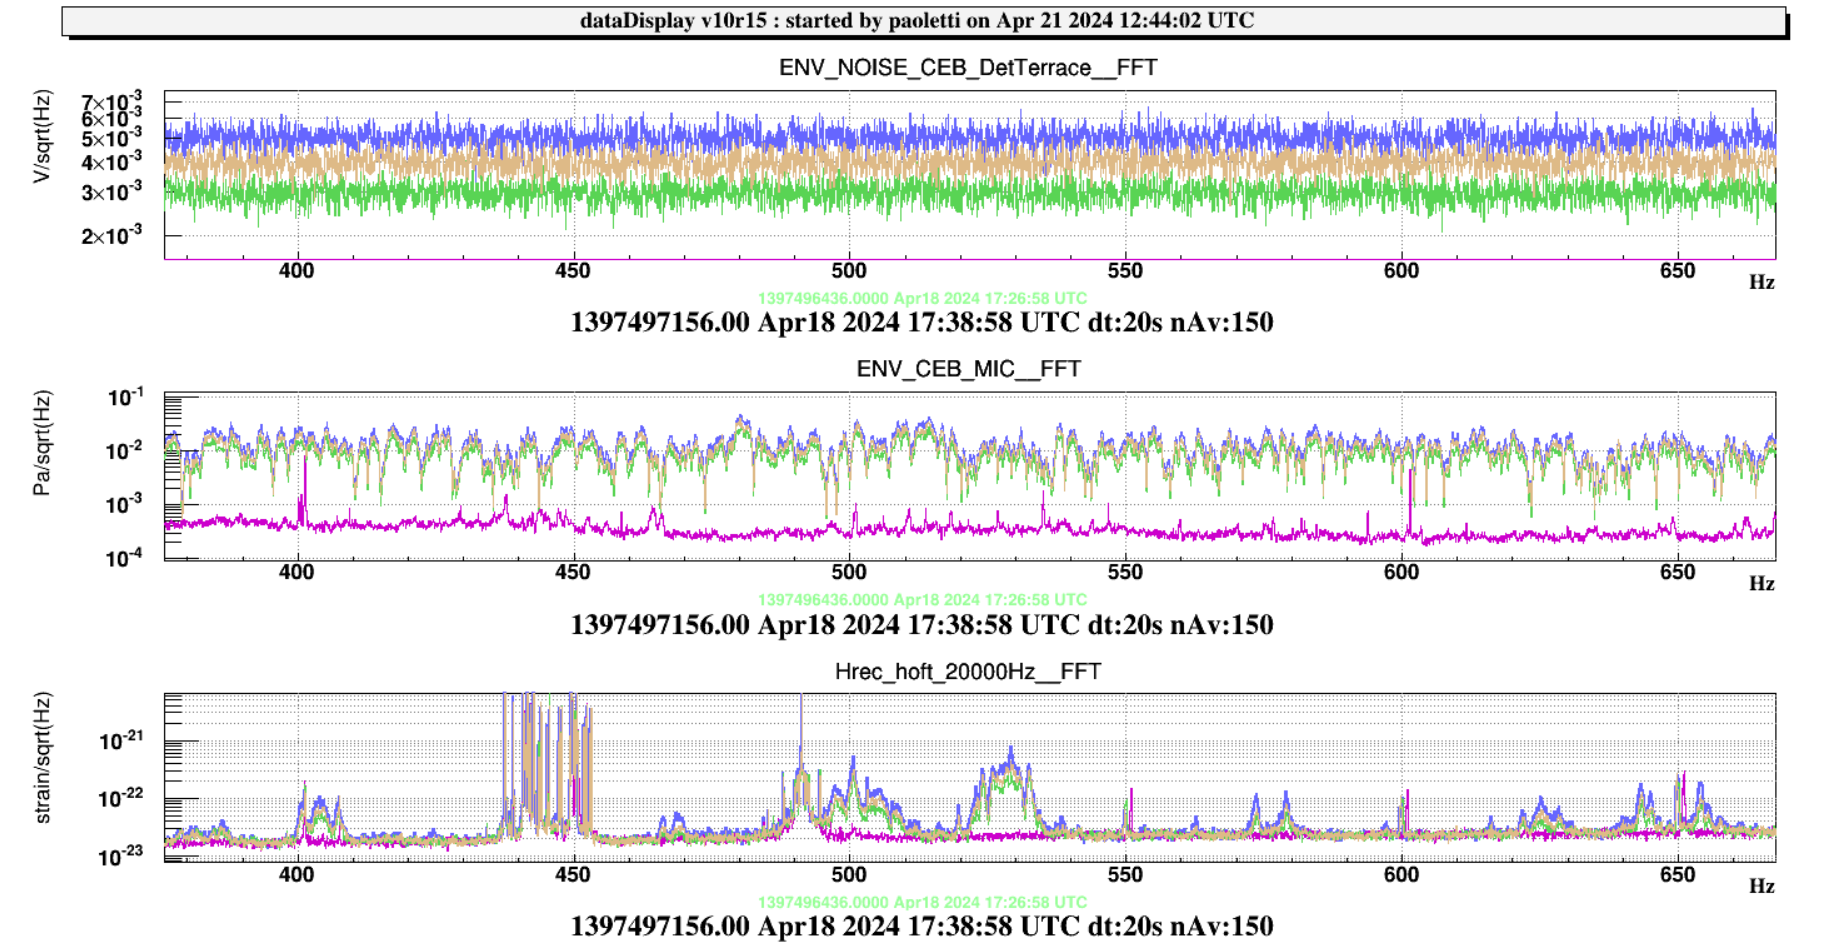
  • acoustic injection in the CEB  with the loudspeaker positioned in the DET terrace: 60s colored noise 8 - 2000 Hz, 0.025 V to the DAC

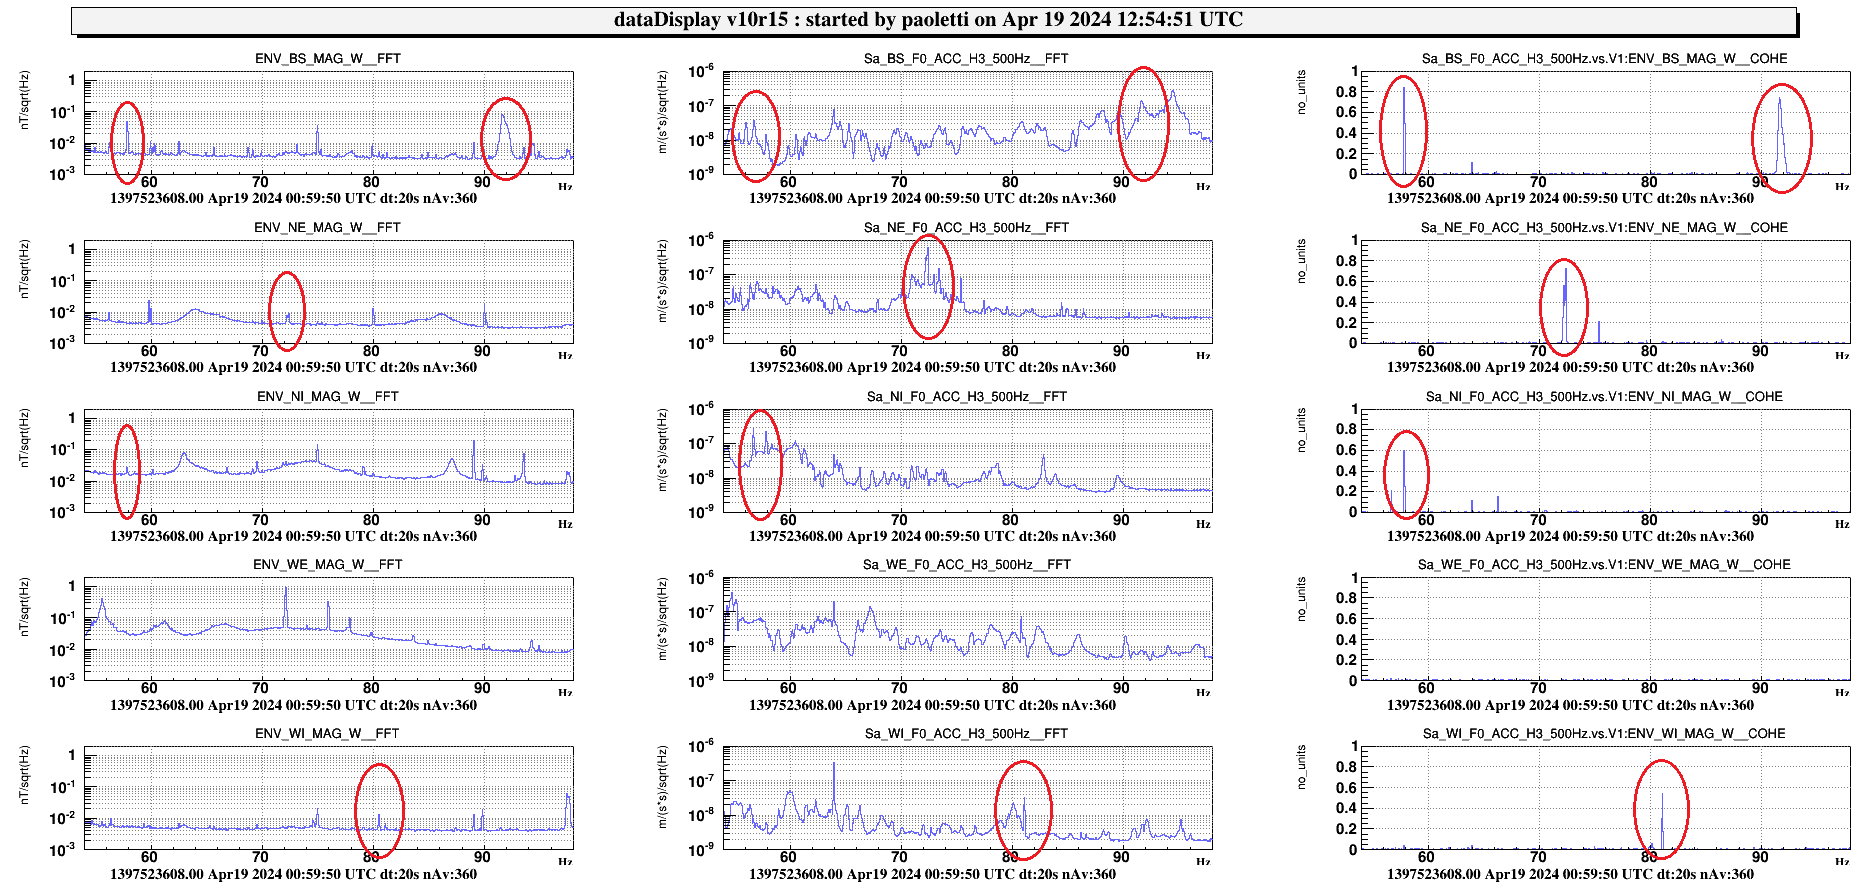
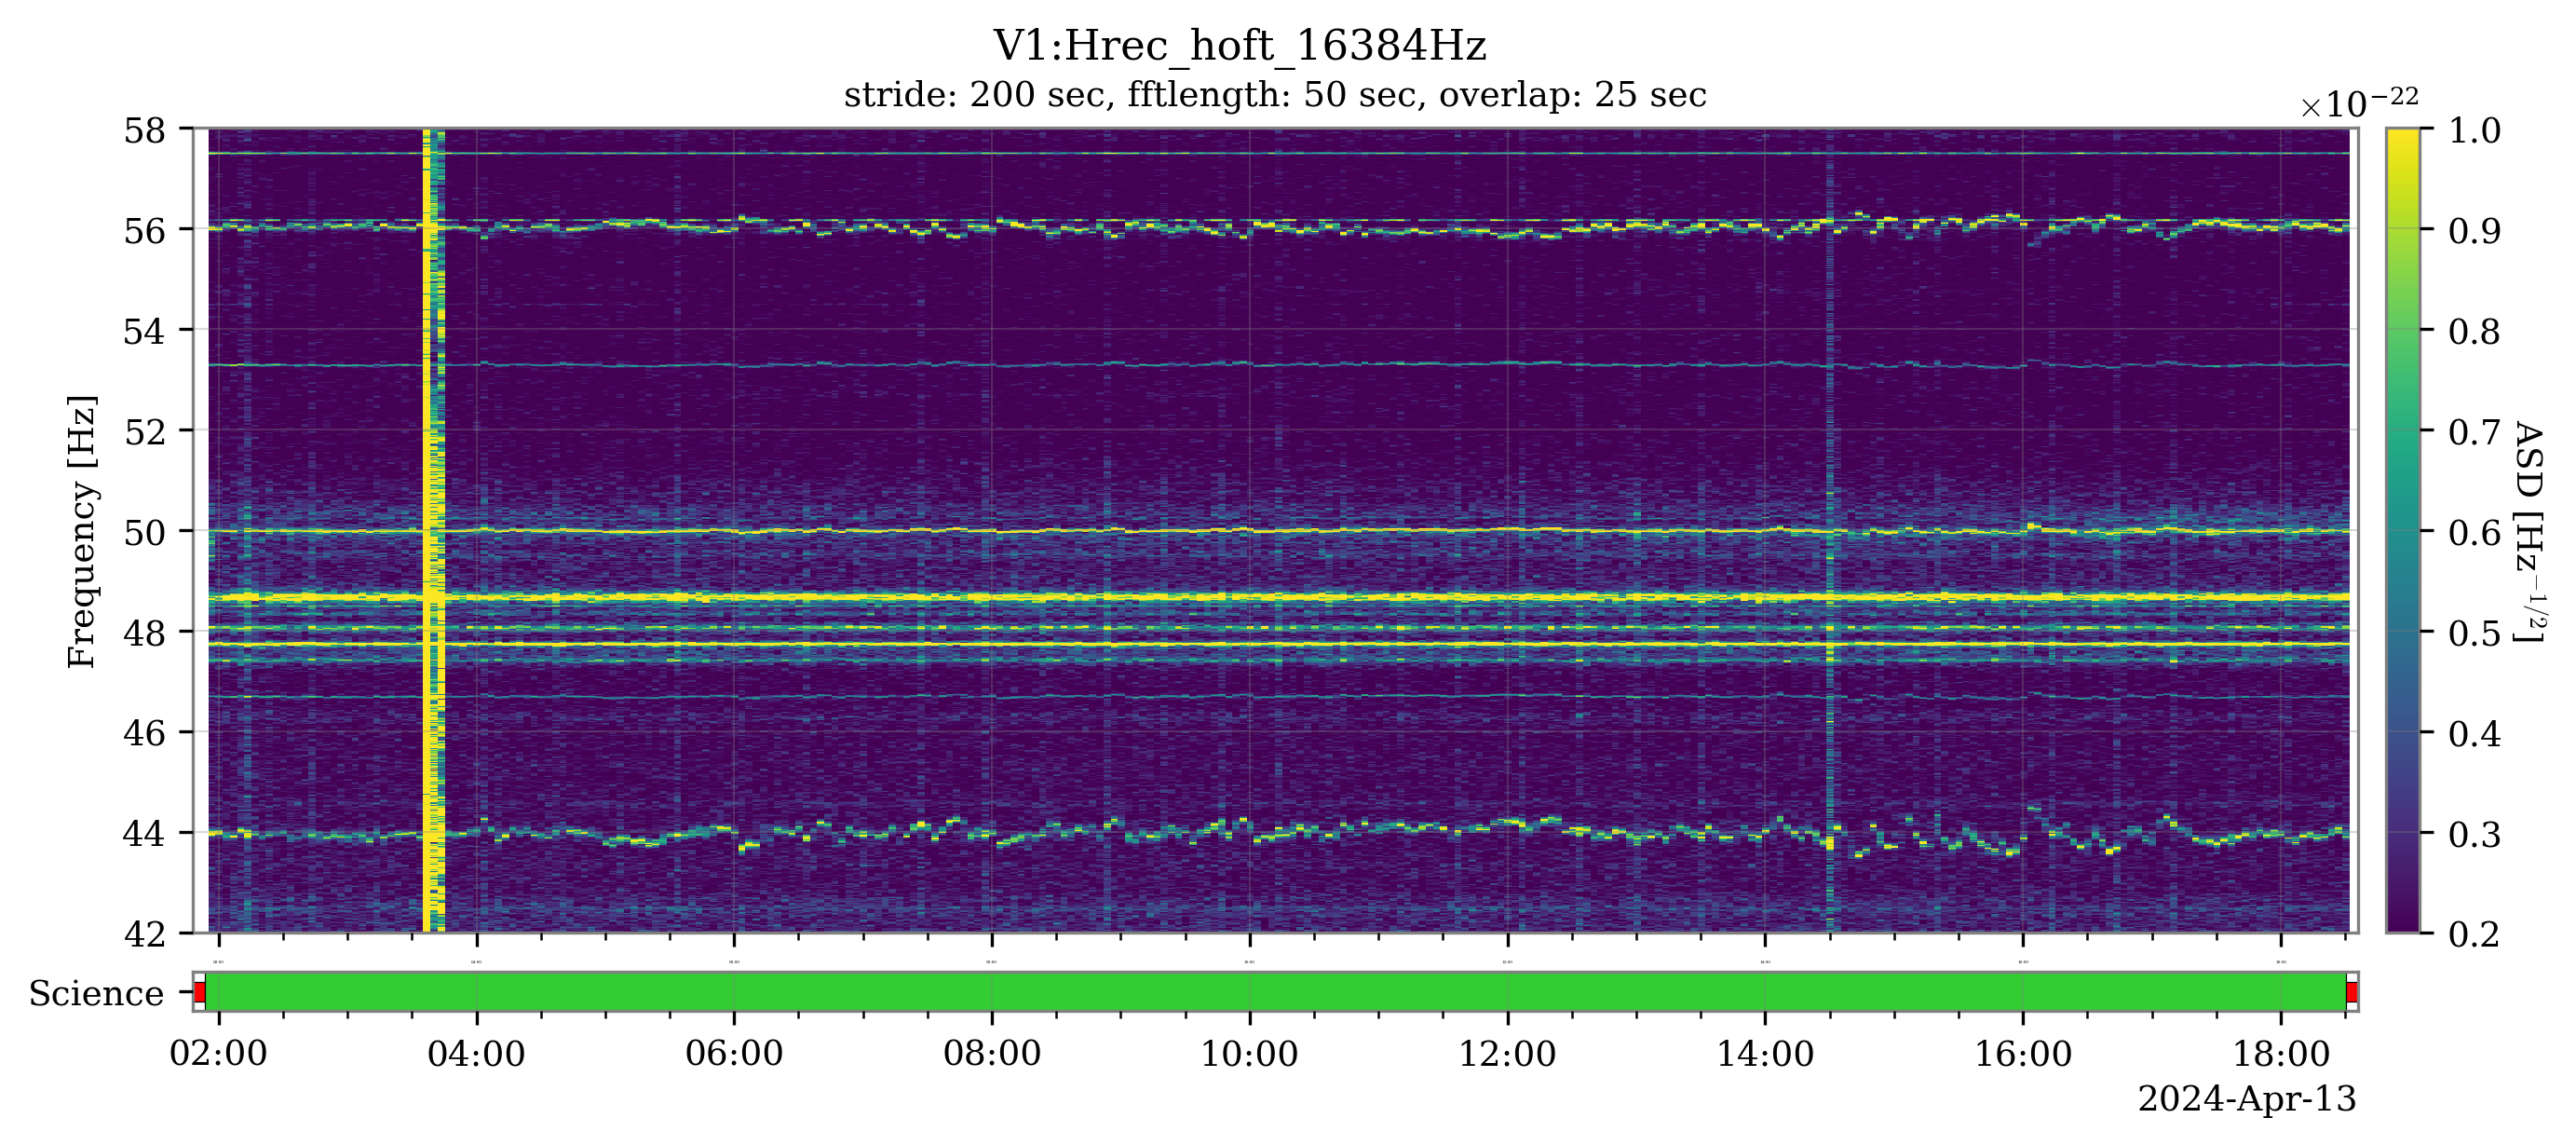
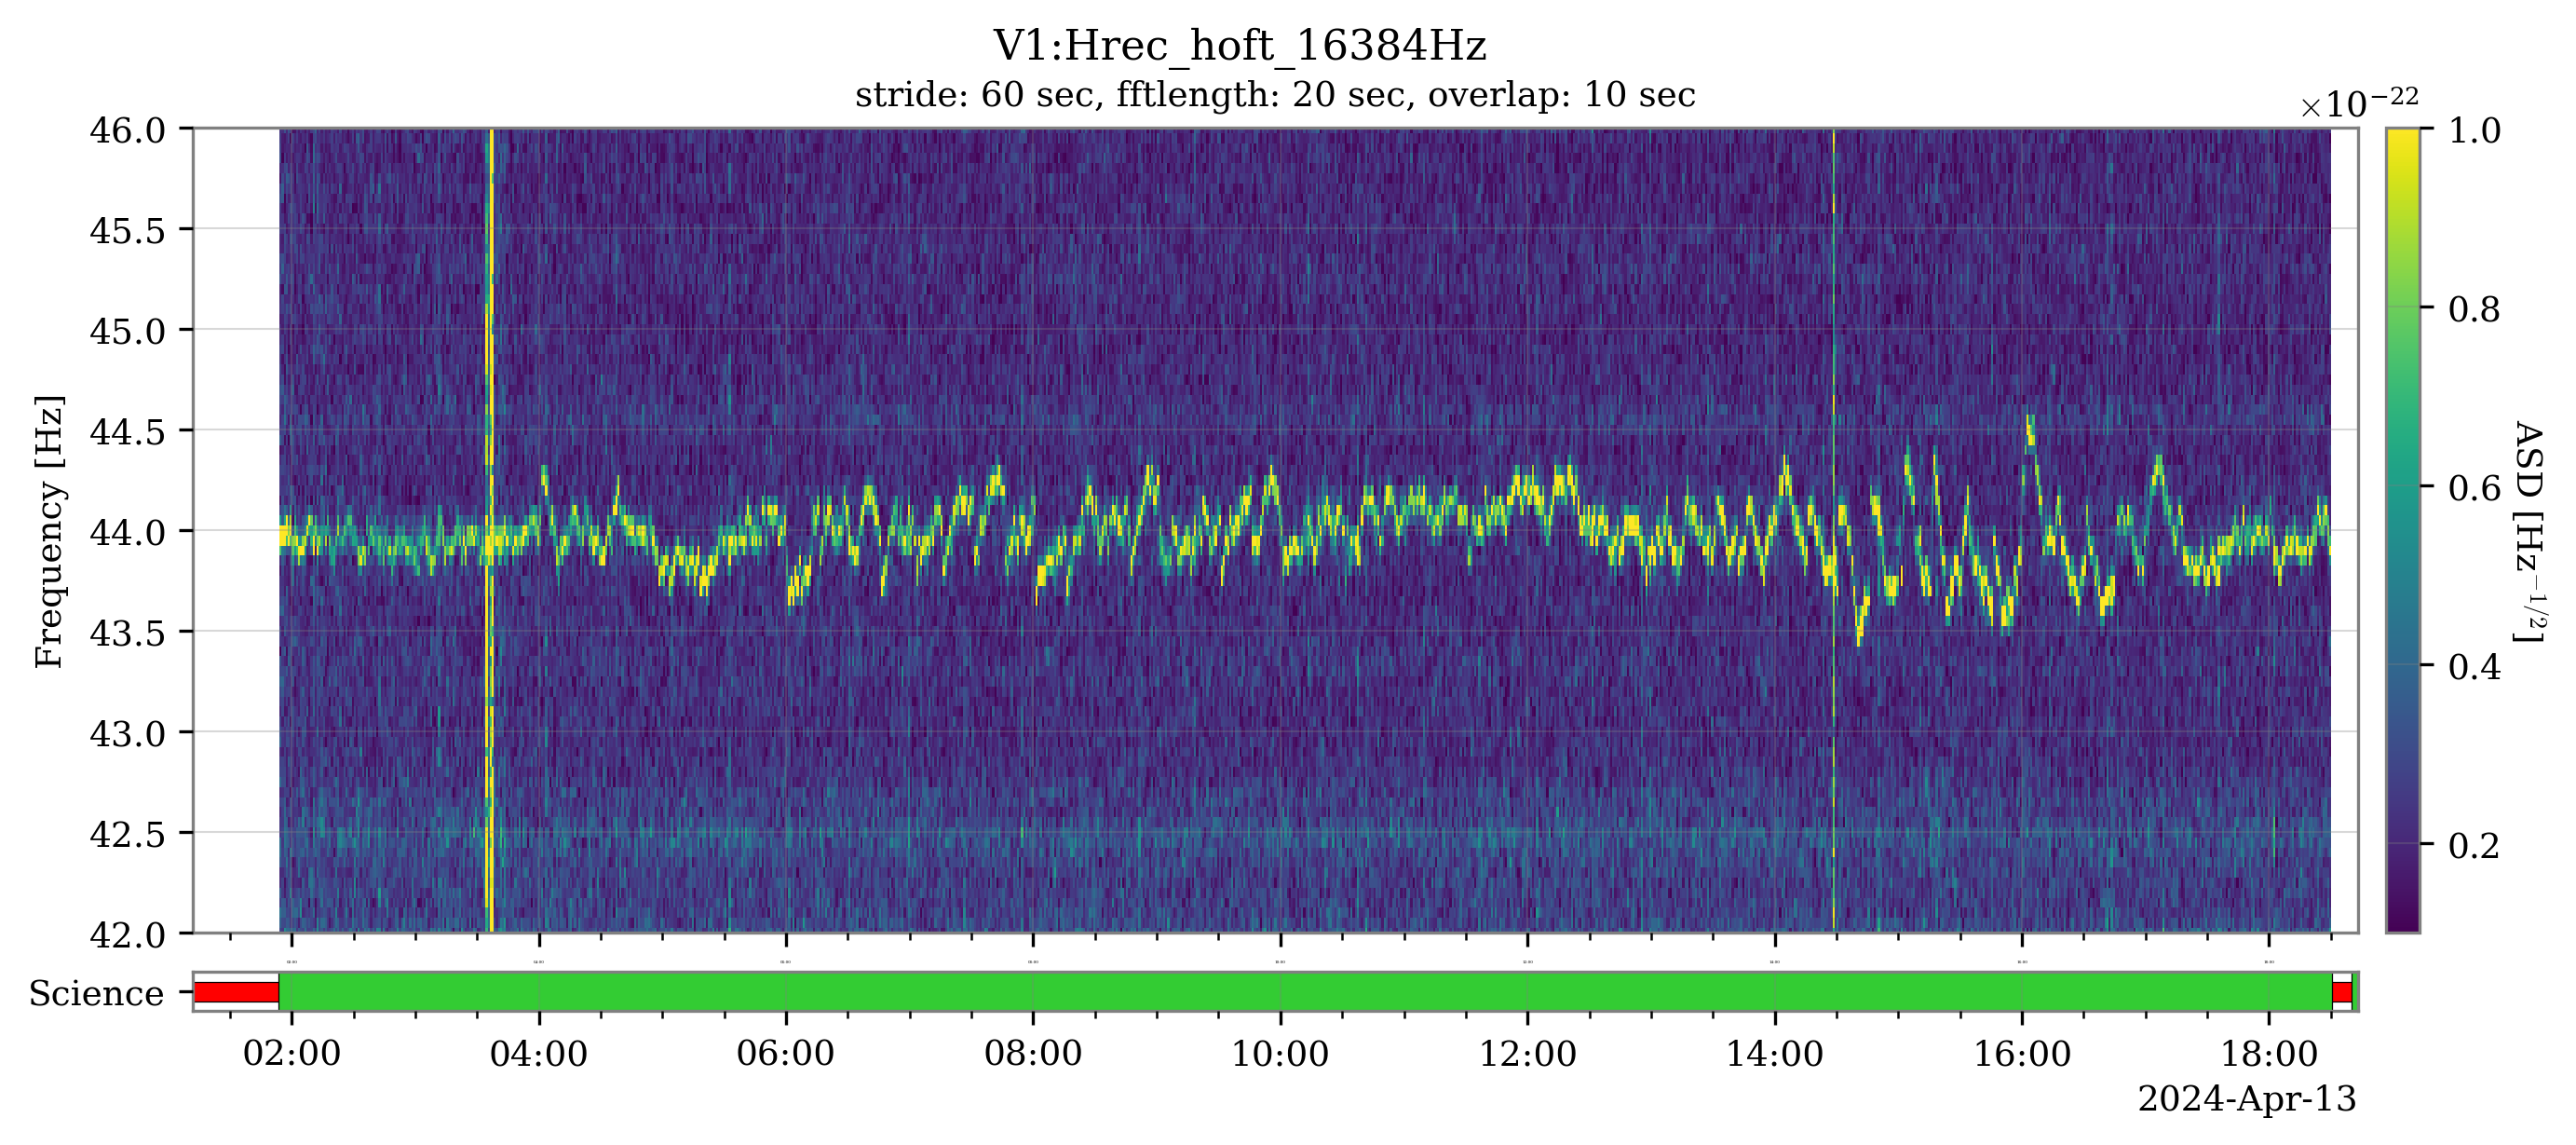
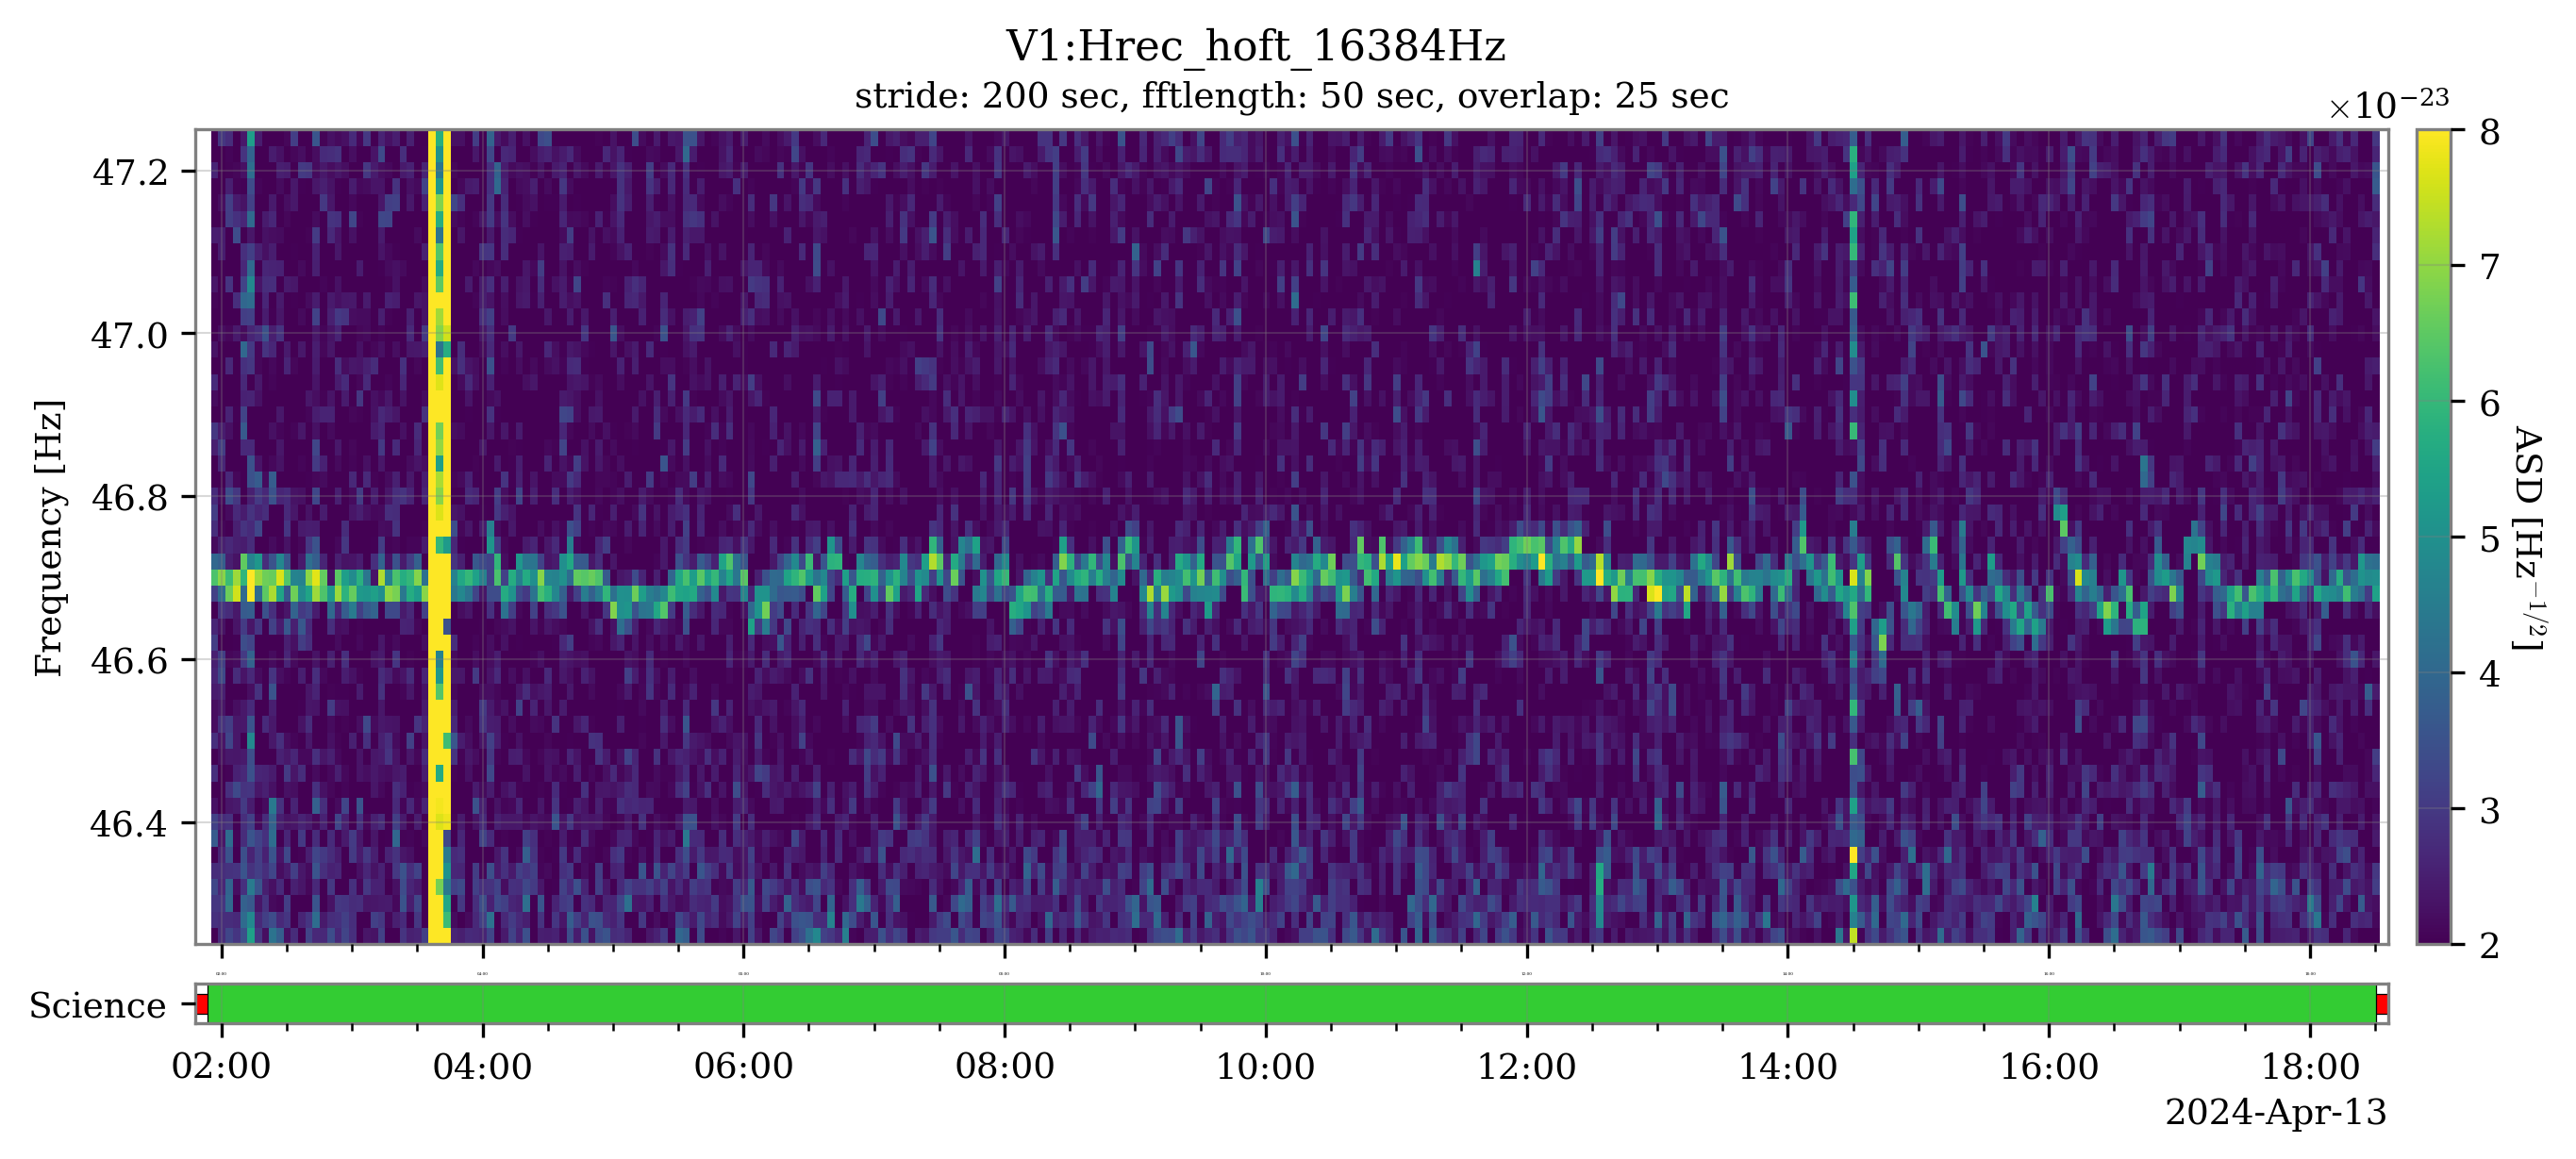
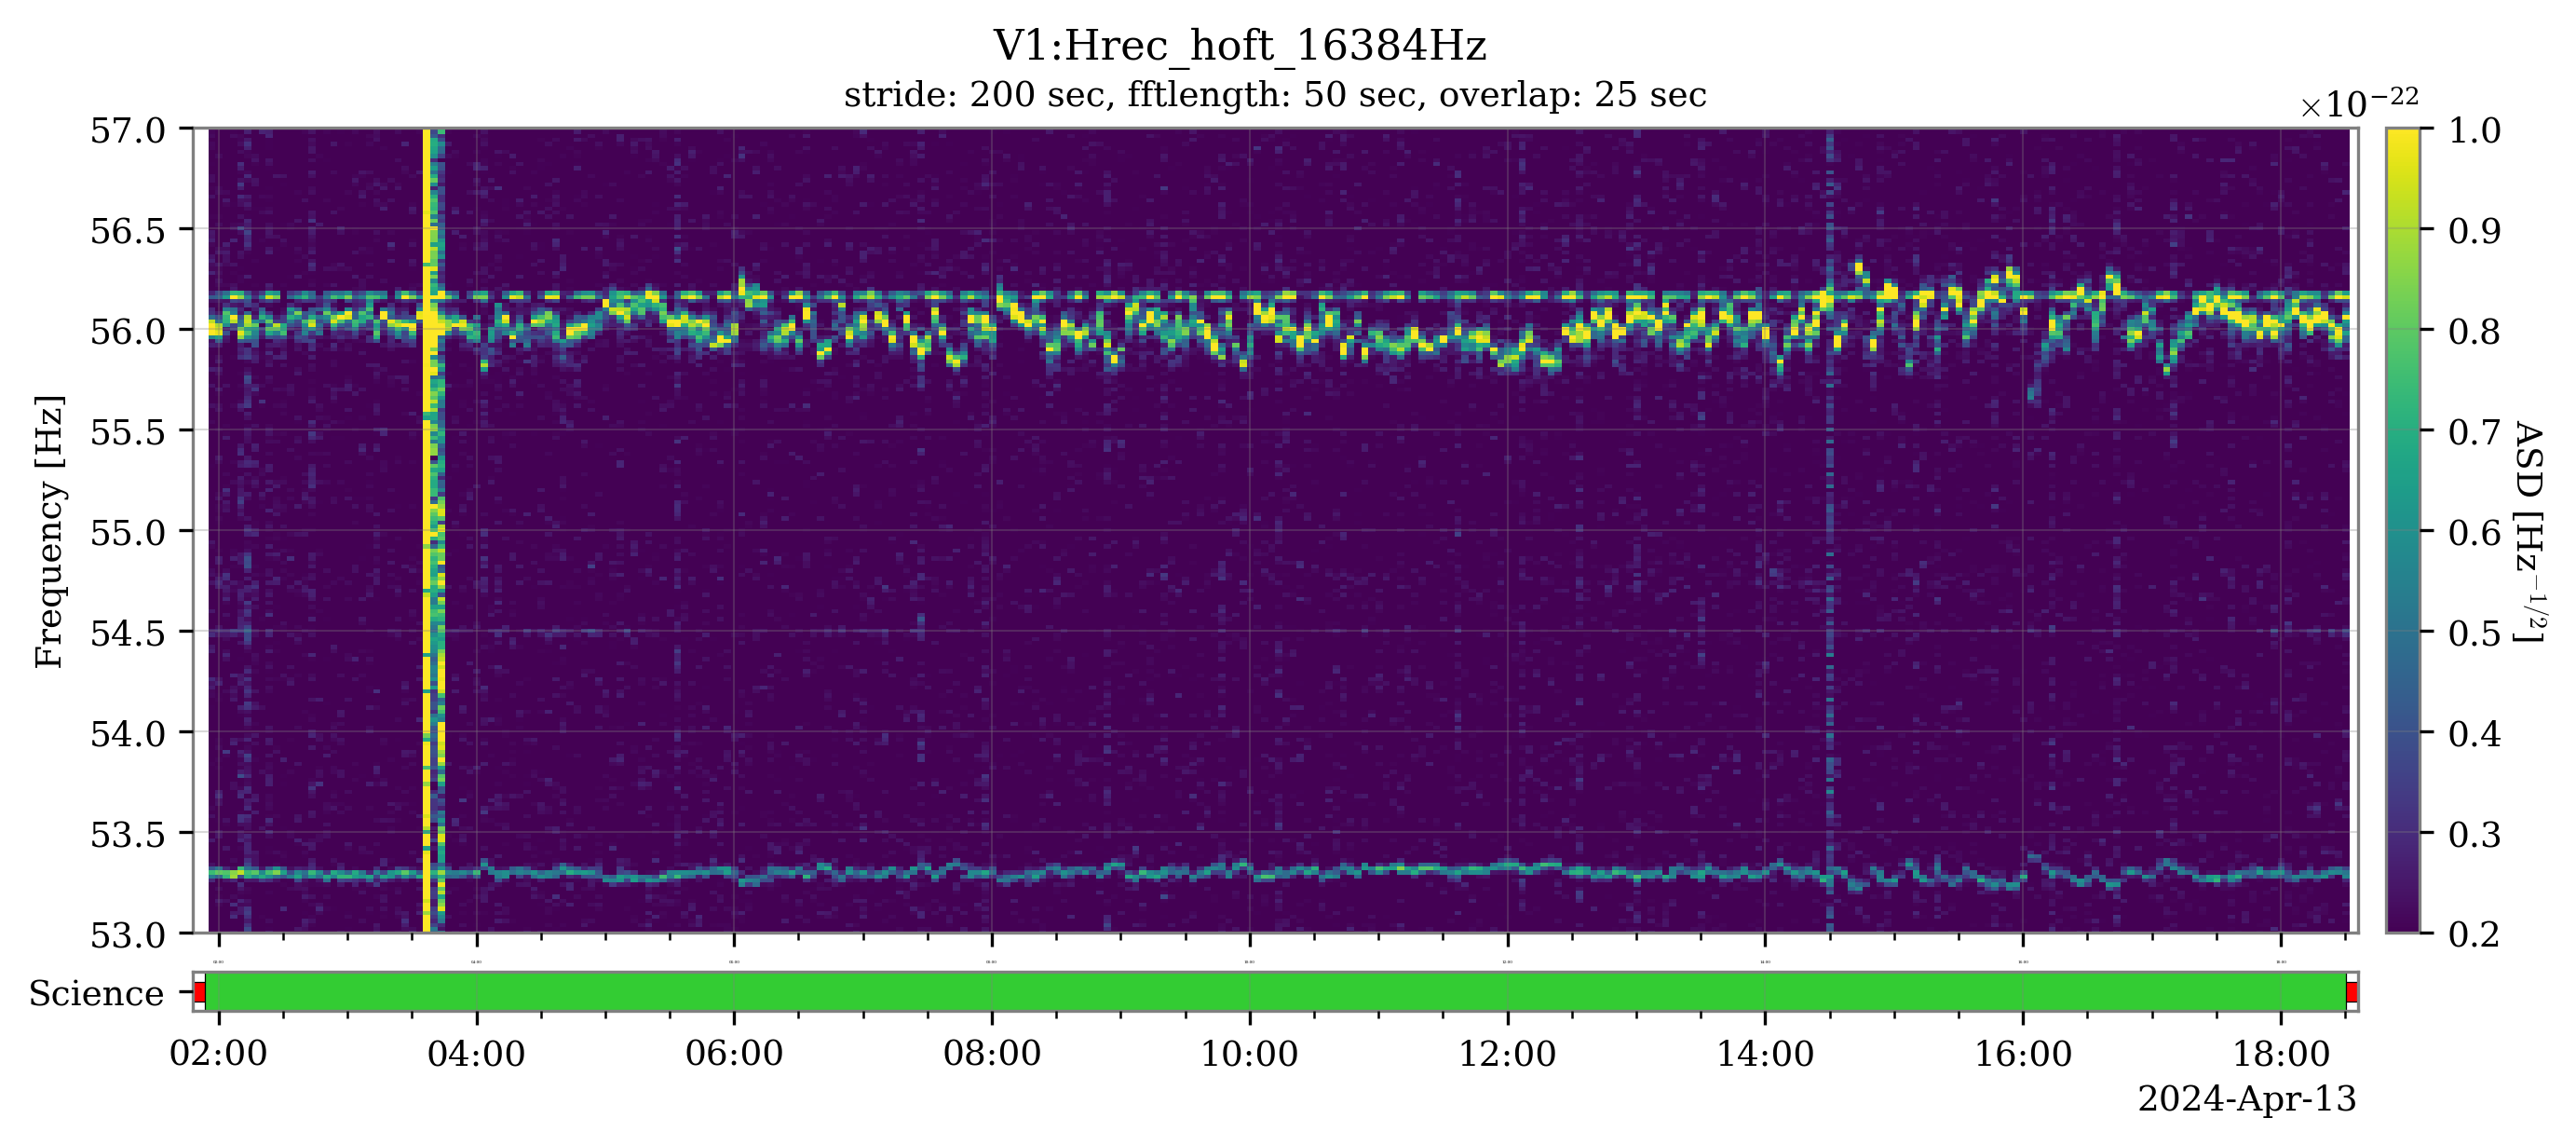
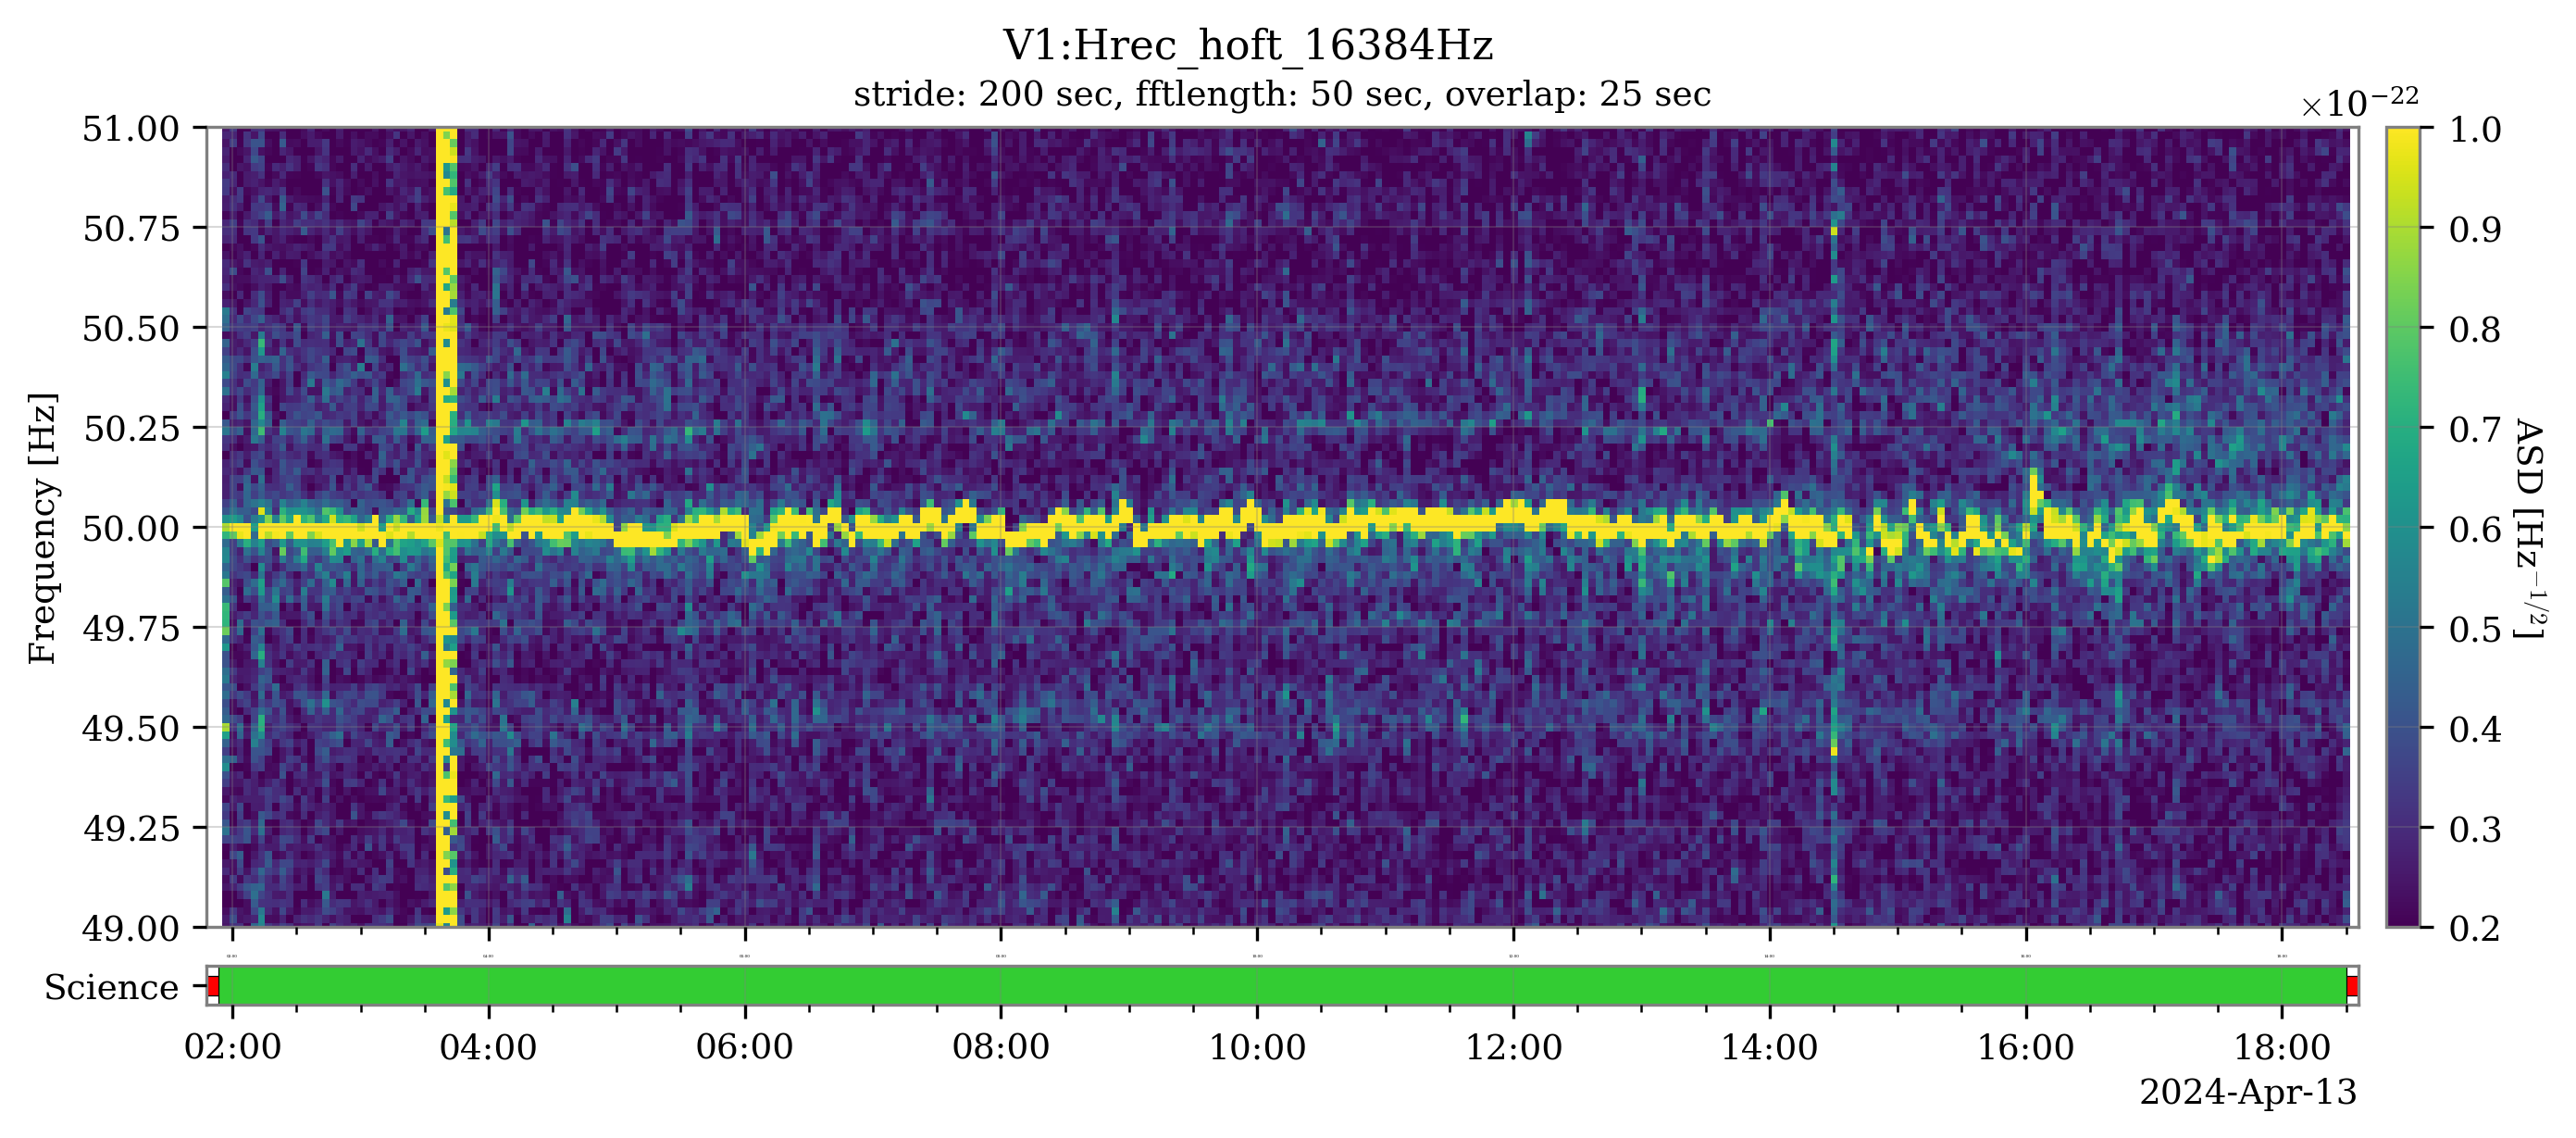
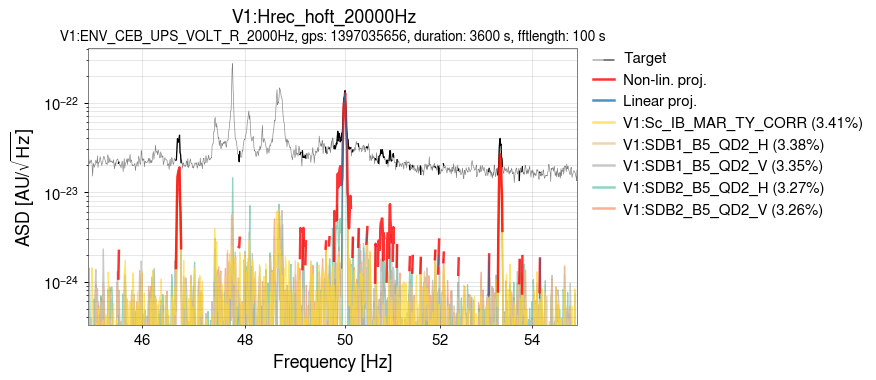
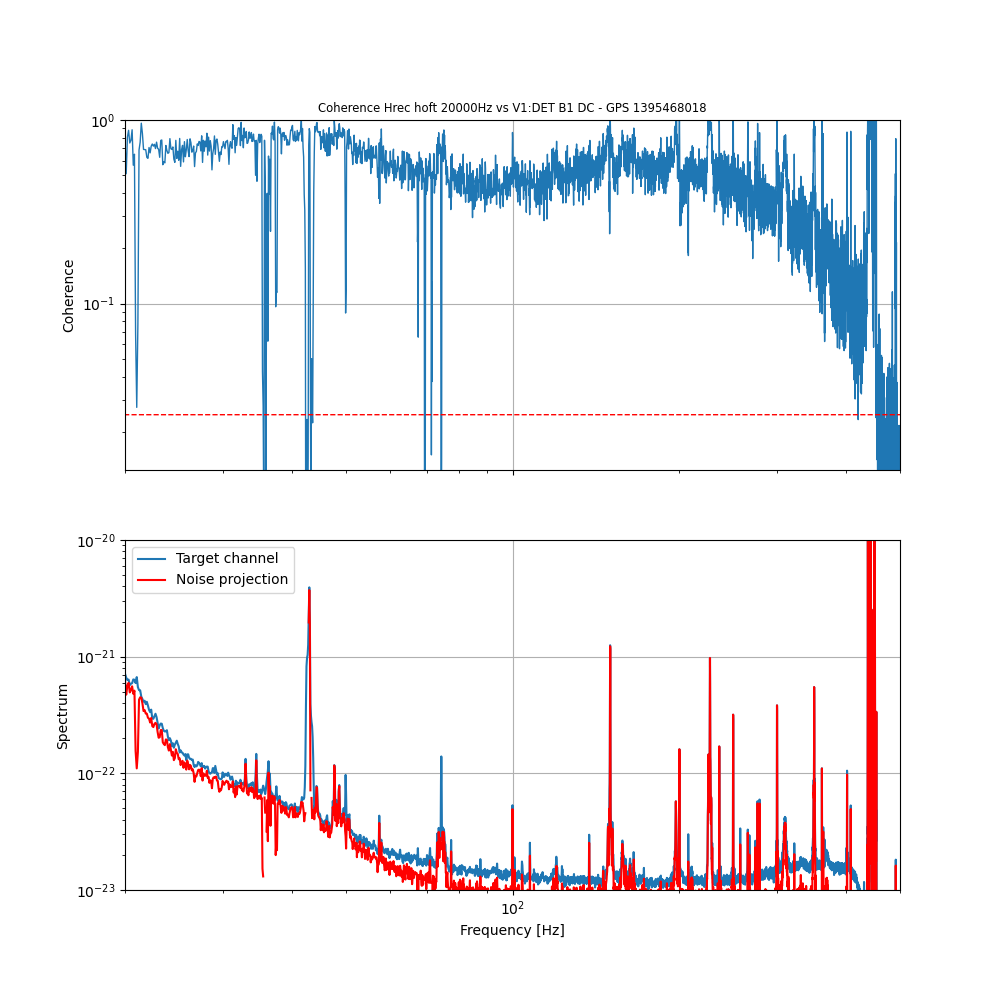
The magnetic injection was succesfully performed at CEB, NEB and NEB (Figure 1). The 9V amplitude although close to the limits for current (6Apk) and Voltage (70Vpk) did not saturate the amplifier (Figure 2). With this amplitude the signal is seen sufficiently well in hrec for NEB and WEB up to about 100Hz. For CEB the signal in hrec looks not so loud (Figure 3) but we might gain a bit by doubling the injection time to 600s. For NEB and WEB the Bartington magnetometers ENV_NE(WE)_MAG_V,N,W placed close to the NE(WE) tower have to be used for the coupling function computation,  because the metronix magnetometers on NEB and WEB saturate for the low frequency part of the sweep.

The output files were successfully produced in the designated directory: /virgoData/NoiseInjections/MagneticInjectionsO4/output/ and /virgoData/NoiseInjections/AcousticInjectionsO4/output/

One thing that is useful to be implemented in is that once the sweep injection is concluded a few seconds are waited before switching off the amplifier.

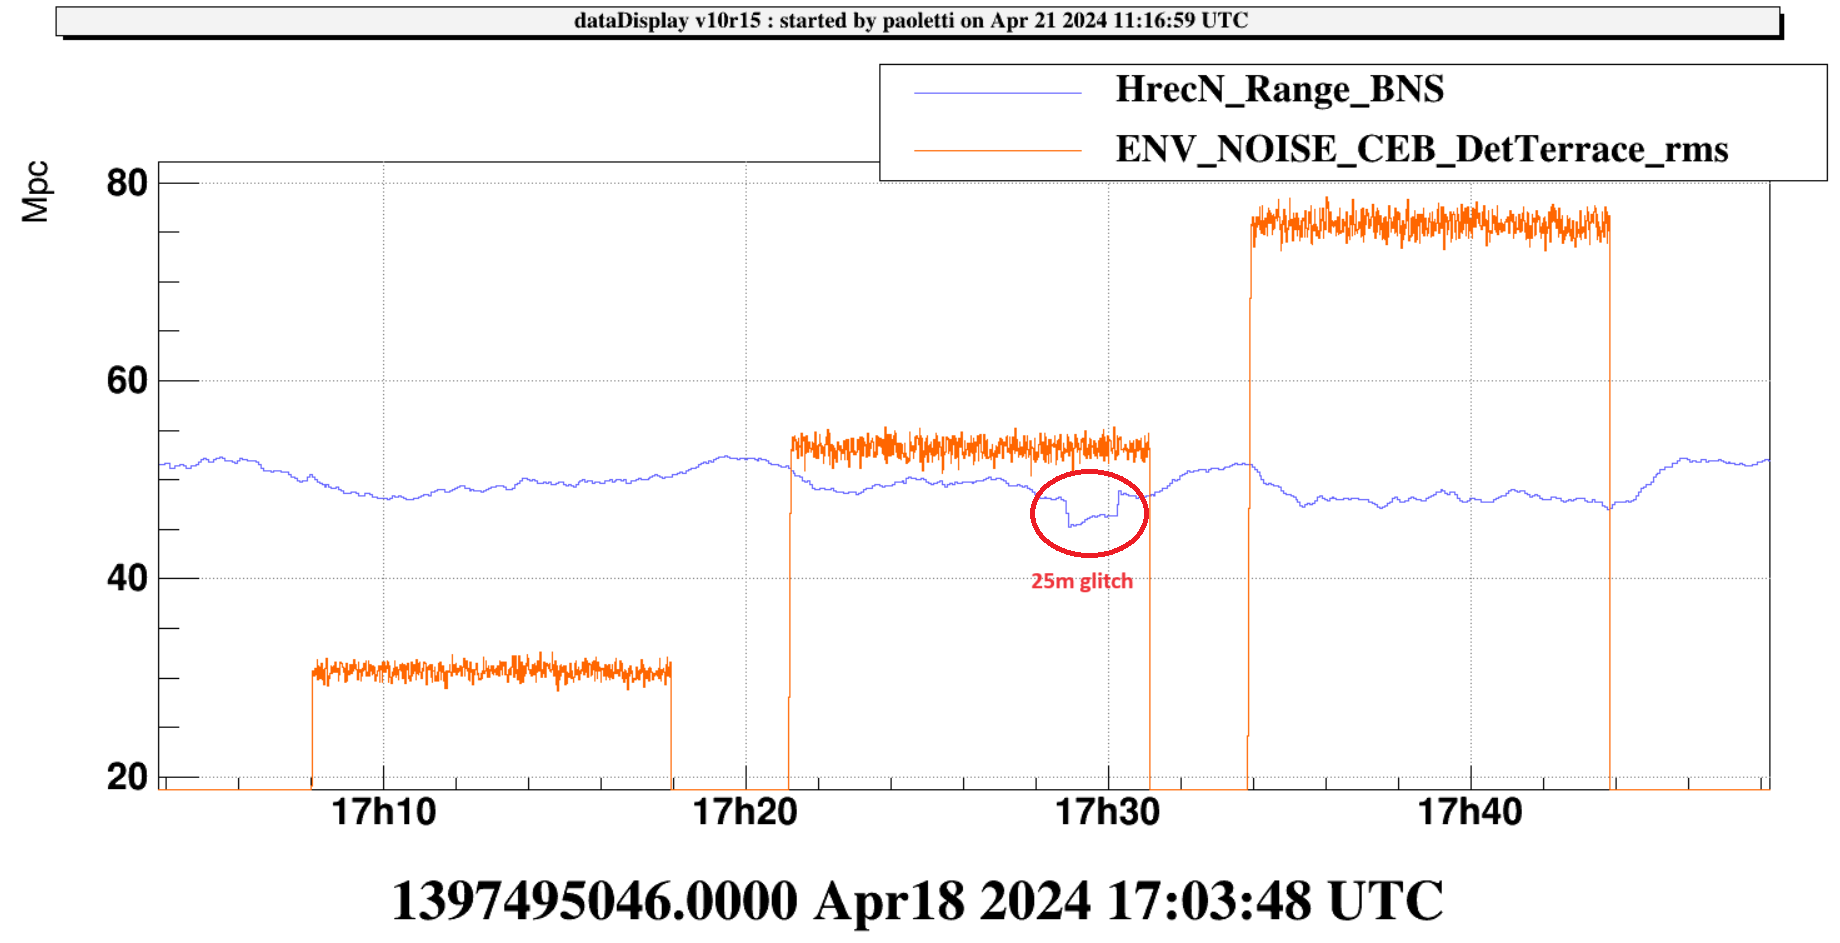
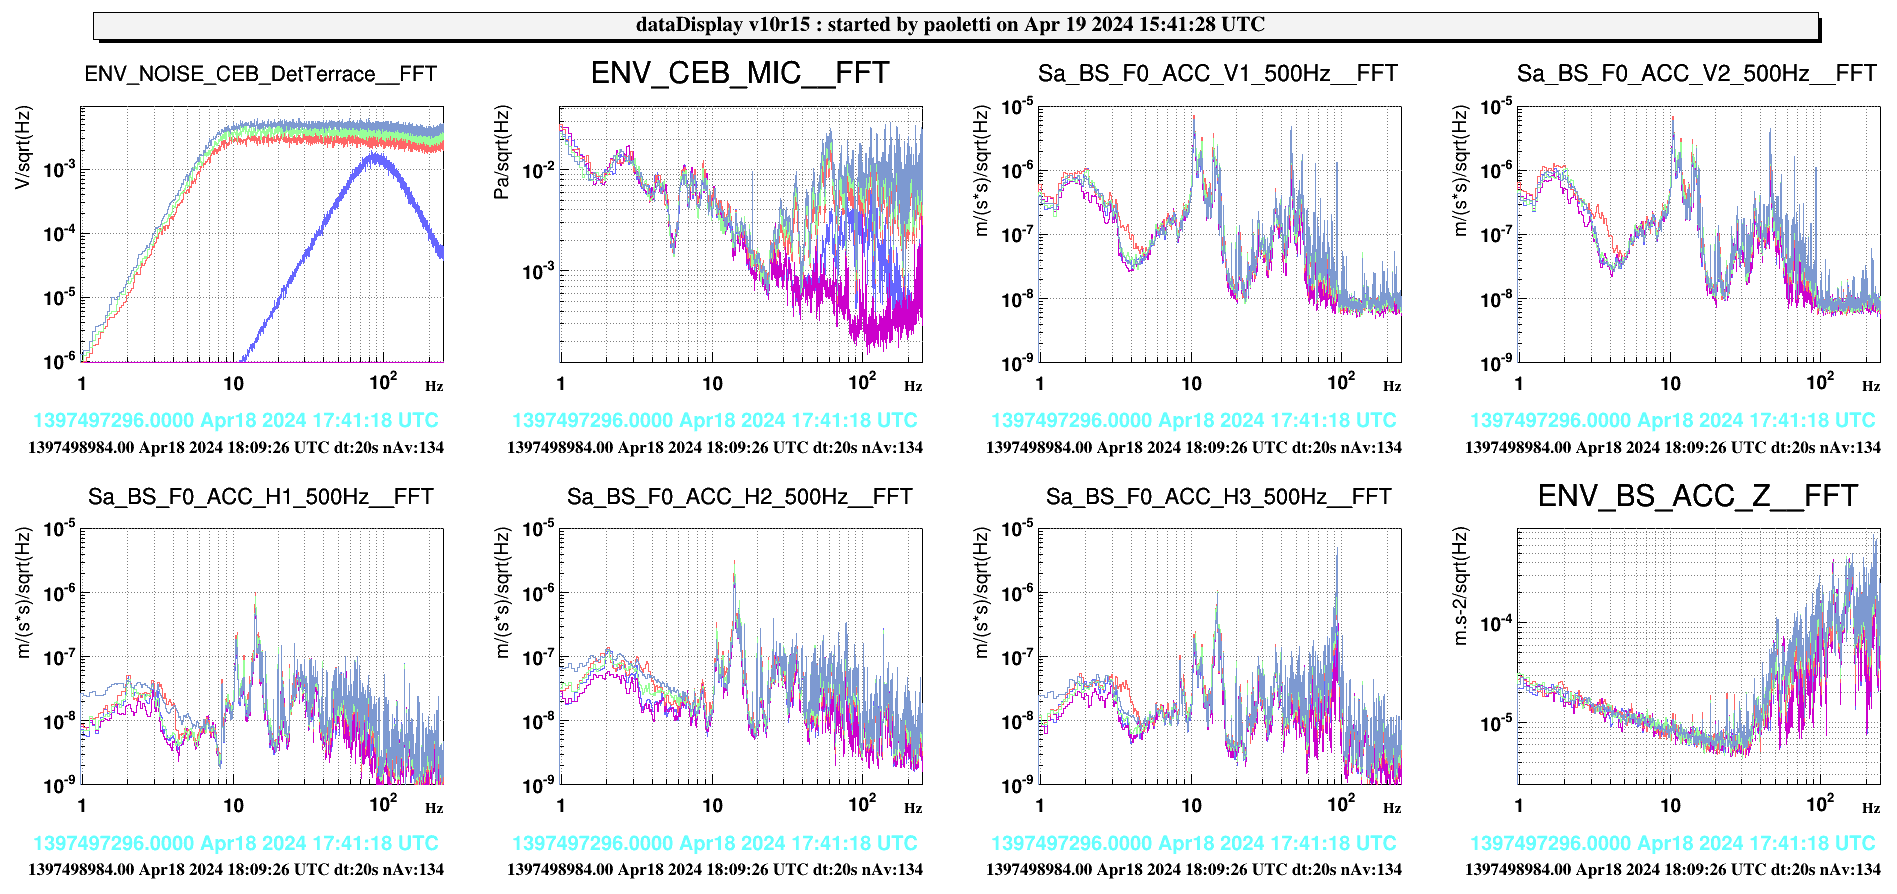
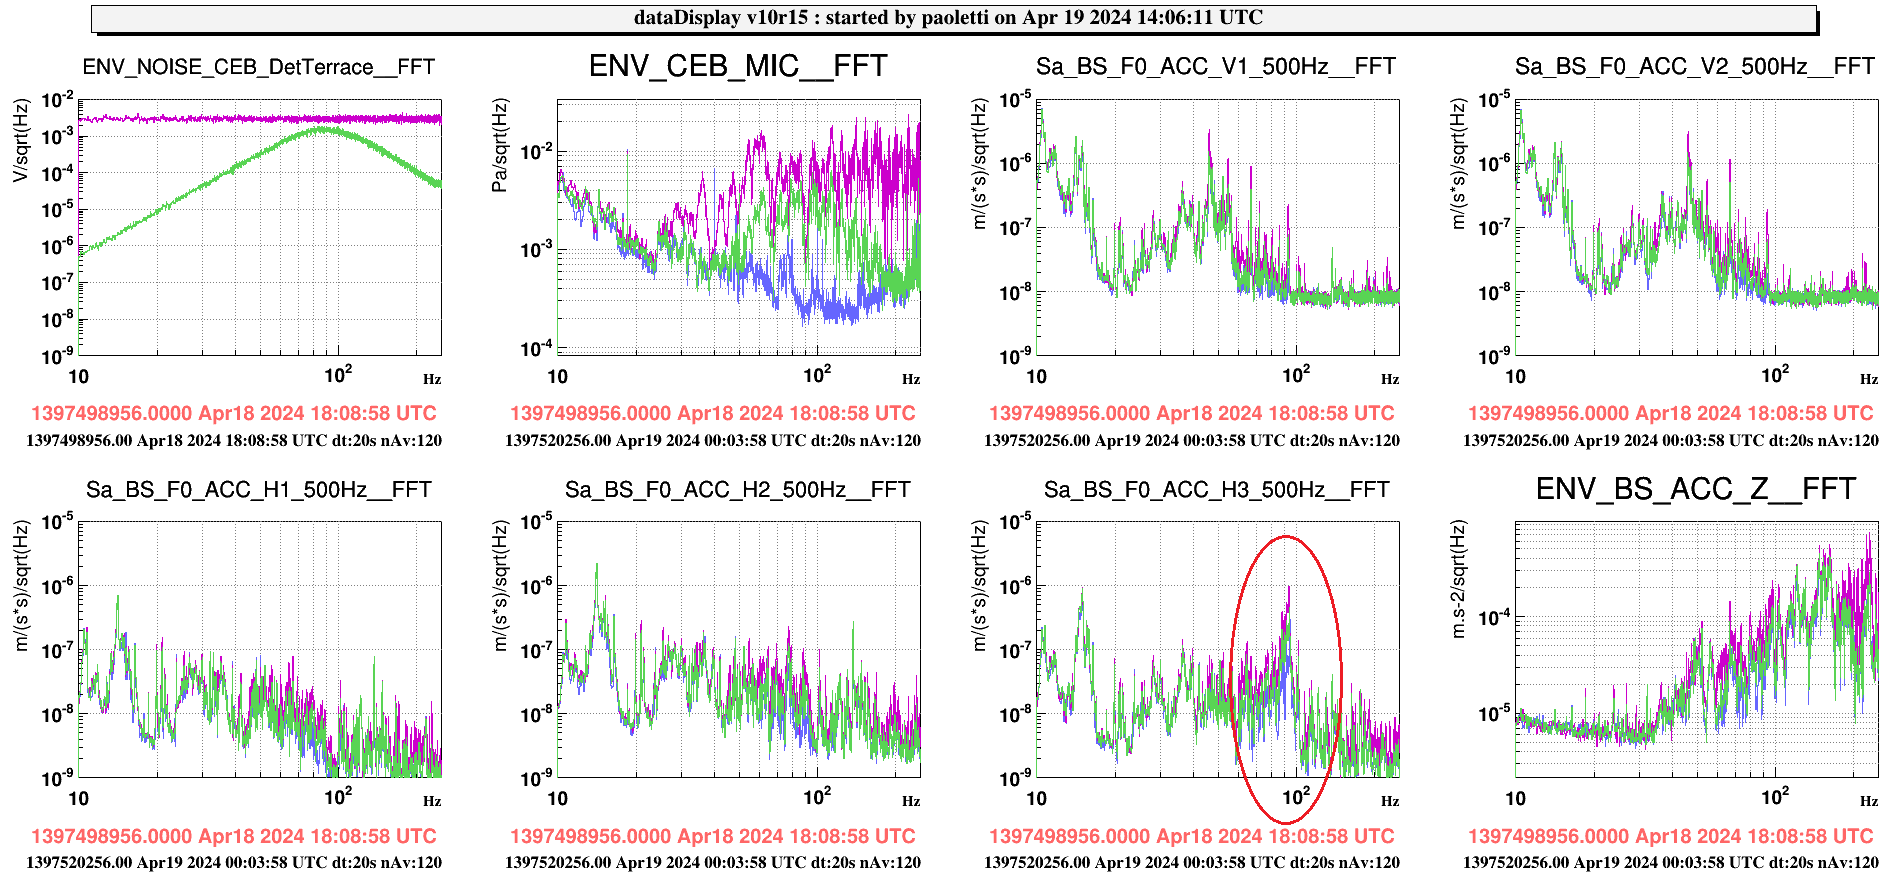
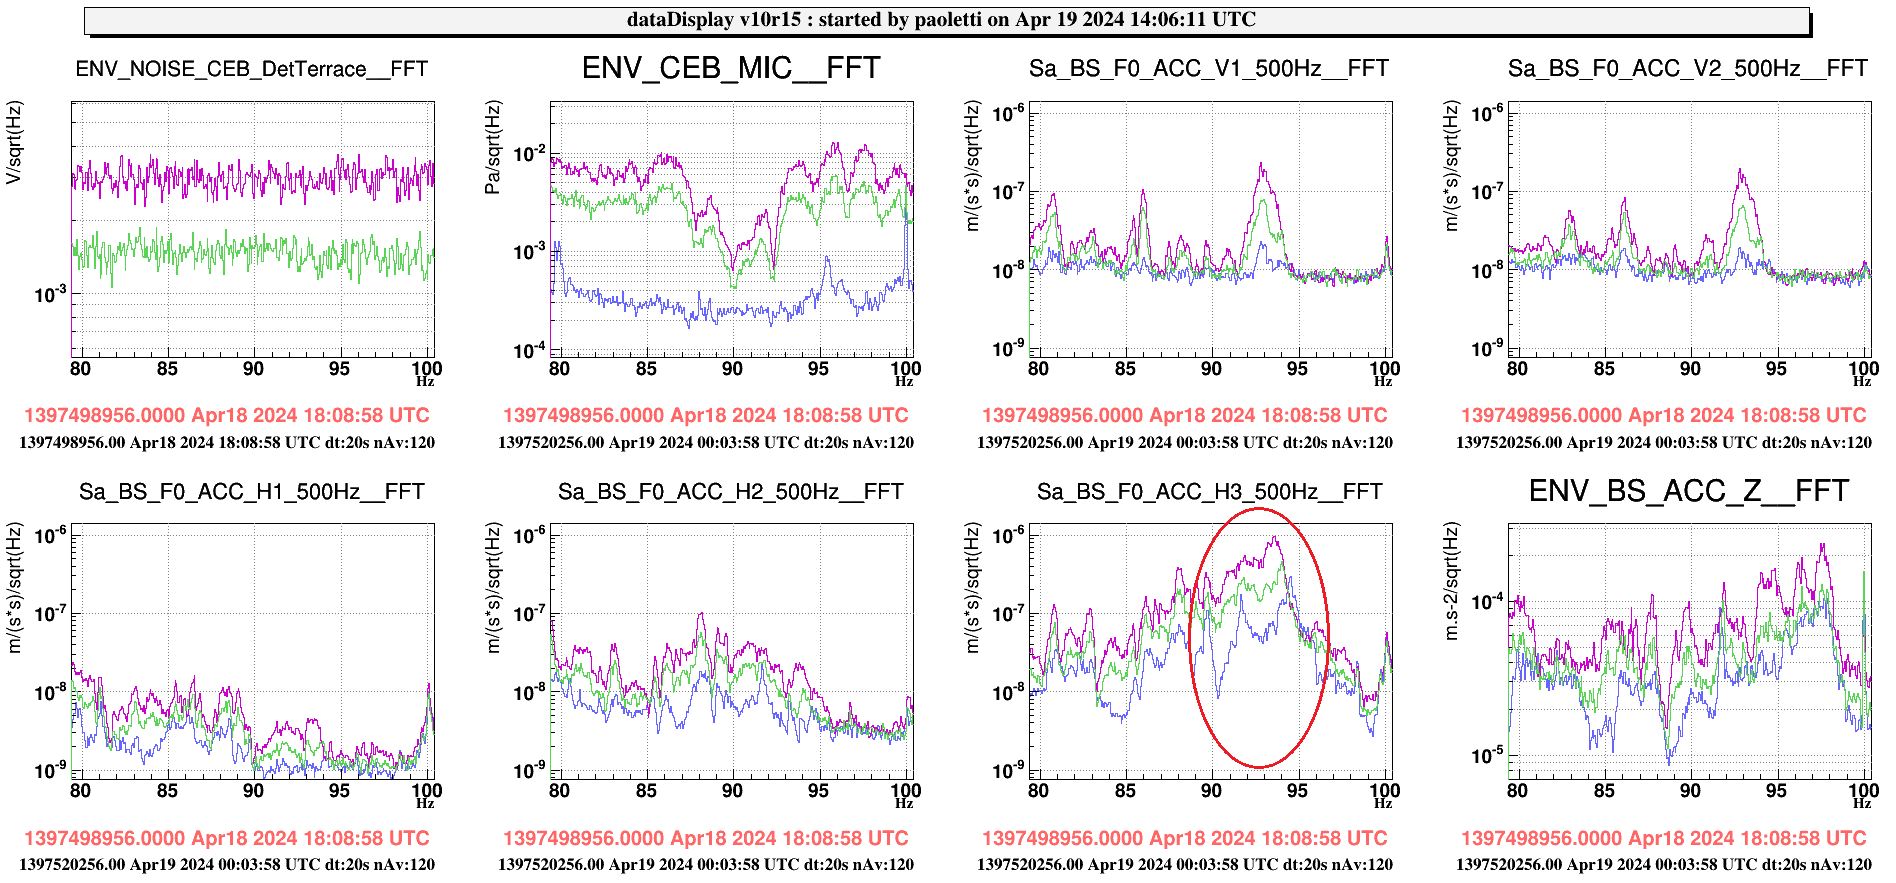
Instead the acoustic injection did not preform as expected because the large spike noise at the beginning of the injection appeared again (!) and of course unlocked the ITF: Figure 4

Indeed, to our understanding this should not have happened since the used

/virgoDev/Automation/userapps/ENV_MAIN.py

now points to the patched version of the code (v2r1p1), which when tested by launching the AcousticInjectionCEB process from the VPM performed ok (i.e. no spike)

.... reading from the ENV_MAIN.py:

#        noise_injection_script = "/virgoDev/EnvSwepts/v2r2/Linux-x86_64-CL7/bin/AcousticColoredInjection-conda /virgoData/NoiseInjections/ENV/AcousticInjectionCEB.cfg"
        noise_injection_script = "/virgoApp/EnvSwepts/v2r1p1/Linux-x86_64-CL7/bin/AcousticColoredInjection-conda /virgoData/NoiseInjections/ENV/AcousticInjectionCEB.cfg

We need Franco or Rhys to have a look into this.

Images attached to this report
Comments to this report:
fiori, tringali, paoletti, masserot - 18:28 Monday 15 April 2024 (63970) Print this report

The issue with the extra spike at the beginning of the colored noise injection was related to time settings in the ACL commands in the ENVnoise process. These modifications were made by Alain (on March 26):

OLD
# commamd - name of output channel - units - output sampling frequency - duration of 0 to 1 transition (s) - duration of 1 to 0 transition (s) - state of transition at startup (see ACL manual)
ACL_RELAY_CH                noise_filter_enbl    "au"    SAMP_FREQ    10    1    1  : the bold 1 means that the relay is equal to 1 at the starting time
# nameOut - unit - rampTime - samplingFreq - density - seed
ACL_NOISE_CH                noise_white            "V"     5    SAMP_FREQ    0.1    : idem the amplitude of the noise at starting time is set to 0.1
NEW
# commamd - name of output channel - units - output sampling frequency - duration of 0 to 1 transition (s) - duration of 1 to 0 transition (s) - state of transition at startup (see ACL manual)
ACL_RELAY_CH                noise_filter_enbl    "au"    SAMP_FREQ    10    1    0 :  relay set to 0 at starting time
# nameOut - unit - rampTime - samplingFreq - density - seed
ACL_NOISE_CH                noise_white            "V"     5    SAMP_FREQ    0.0   : noise amplitude set to 0 too

Figure 1 shows the result of the test: blue is with the OLD settings, purple is the with the NEW settings (the same colored noise with amplitude 0.025 V has been injected in both cases). The spike is no longer present.

The same test was done by injecting the colored noise from the ENVnoise and also using the ENV_MAIN node which calls the AcousticInjectionCEB process.

Images attached to this comment
fiori, tringali, ruggi - 23:26 Monday 15 April 2024 (63972) Print this report

On April 9 we performed a set of short (60s) colored acoustic injections in the CEB. The ITF was locked in LOWNOISE 3 since a few minutes.

The purpose was to tune the level of the injection in such a way to avoid triggering the 92 Hz oscillation of the BS F0 accelerometers (mostly Sa_BS_F0_ACC_H3) which caused unlocks in the past (https://logbook.virgo-gw.eu/virgo/?r=63709). The purpose of the present test was not to understand the nature and physical reason of the oscillation onset, which remains to be understood.

We injected colored noise between 20 and 2000Hz with 3 levels: 0.03 V, 0.04 V and 0.05 V, one 25min glitch occurred right at the beginning of the 0.05 V injection (Figure 1).

The intensity on the acoustic noise produced in the hall, measured in the position of the hall microphone, was of the order of a factor 20 above the quiet condition (Figure 2). The 92 Hz oscillation of  the BS F0 ACC H3 accelerometer onsets already with the 0.03 V but  amplifies x5 and x10 when the injected level increases from 0.03V to 0.04V and from 0.03V to 0.05V, respectively (Figure 3).

Figure 4 shows the impact on hrec. The noise in hrec increased at some structures, mostly known to be associated to SDB1. These excitations are well visible with all injected levels (Figure 5, which also shows the 25min glitch).

It seems to notice also an increase of the 74 Hz line (DARM loop gain) and the 227 Hz line (SSFS loop gain). As well, it seems to notice a small increase of the noise in the bucket. It seems that particularly the injection at 0.05 V, brings the ITF to a different working point where other noises (e.g. frequency noise) are more coupled.

However, spectrograms in Figures 6 and 7 indicate that the amplitude of 74 Hz and 227 Hz lines was not so stable during the injection period (we were at the beginning of a lock) and its correlation with single acoustic injections is not straightforward.

Paolo's suggestion is to better study this behaviour with longer injections.

Images attached to this comment
Fiori, Paoletti, Tringali - 20:14 Thursday 18 April 2024 (64024) Print this report

We performed a set of four acoustic injections in CEB with the AcousticInjectionCEB VPM process:

1) 17:07:55 UTC - (8 - 2000) Hz, 600 sec, 0.03 V

2) 17:21:05 UTC - (8 - 2000) Hz, 600 sec, 0.04 V  (25 min glitch at ~17:29:24 UTC)

3) 17:33:48 UTC - (8 - 2000 )Hz, 600 sec, 0.05 V

4) 18:04:40 UTC - (80 -100) Hz, 300 sec, 0.04 V

The directory path of output files is /virgoData/NoiseInjections/AcousticInjectionsO4/output. The list of file injections is reported below:

1) AcousticColored_NOISE_CEB_DetTerrace-1397495261.txt

2) AcousticColored_NOISE_CEB_DetTerrace-1397496052.txt

3) AcousticColored_NOISE_CEB_DetTerrace-1397496814.txt

4) AcousticColored_NOISE_CEB_DetTerrace-1397498666.txt

Paoletti, Fiori, Tringali - 18:02 Friday 19 April 2024 (64032) Print this report

We tested the sensitivity of the top-stage BS accelerometers at three different levels of acoustic injection (nominally 0.03 - 0.04 - 0.05 V).

Noise was filtered from 8 to 2000 Hz, but the actual noise produced was only from 20 Hz and up, as the speaker is unable to go lower.


The fourth injection (18:04:40 UTC - (80 -100) Hz, 300 sec, 0.04 V) aimed to produce the same level around the frequency of ~93 Hz (without generating out-of-band noise) where one of the horizontal BS F0 accelerometers (Sa_BS_F0_ACC_H3_500Hz) is usually excited during acoustic injections, in order to check whether the coupling is linear or not.

Unfortunately, the filter was too narrow, and the noise spectral density at 93 Hz was lower than expected.

However, we can say that generating a higher level by a factor of 2 (with no noise at lower frequencies) resulted in an increase of the peak by about a factor of 2 (difficult to estimate accurately). It appears that there is no upconversion and the system is "linear."


During this test we also noticed that there is some (unexplained) coherence between the upper stage F0 accelerometers and the lower external magnetometers (this is also the case in other towers besides BS).

At first glance one might think of general coupling due to the external accelerometer cables running not too far from the magnetometers (as indeed they are), but there are high-level signals in the acceleration spectrum that have no coherence. If it were a coupling from the cable, it should be broadband.

Images attached to this comment
Paoletti, Fiori, Tringali. - 15:18 Sunday 21 April 2024 (64048) Print this report
Images attached to this comment
AdV-ISC (Commissioning up to first full interferometer lock)
spinicelli, tringali, gherardini, casanueva, bersanetti, nardecchia, sorrentino, mwas - 11:47 Thursday 21 March 2024 (63691) Print this report
Strange behavior of Etalon loop and NI RH temperature probe after processes restart

Yesterday morning we noticed a strange behavior of the Etalon loop, both on NI (fig. 1) and WI (fig. 2) tower, probably due to the restart of some ACL servers that generate the signal for the control loop while the loop was still ON.  

In particular, the loop seemed to have an inverted sign as it was heating the tower when the RH probe temperature was above the setting point. A stop/start of both loops (NI: 15h53m-UTC; WI: 17h57m-UTC) seemed to solve the problem (see fig. 3). However, as observed by Michal, it is possible that this huge and fast change of temperature of the two towers (fig. 4) had an effect on the lock stability and on the sensitivity.

Due to the slow control of the loop, the effect of the issue were visible with a huge delay; we then decided to postpone the start of the etalon scan, expected for the beginning of the ER. From the data of this morning, I would suggest not to start the scan before the end of the day in order to start with a stable initial state.

Beside, it is worth to notice also a strange behavior of the NI RH temperature probe. In figure 5 we can observe that after the lost of data due to the server restart of tuesday morning (between 7:10 and 8:30 UTC), the temperature read on the NI RH did a jump (and the same did the NI etalon err signal), while on the WI its behavior was as expected.  

Images attached to this report
Comments to this report:
mwas - 10:15 Monday 25 March 2024 (63727) Print this report

Figure 1. The NI etalon has nicely stabilized over the past few days to fluctuations of ~20mK peak to peak, but the WI etalon fluctuations are not decreasing, with fluctuations remaining at the ~100mK peak to peak. Is there a need to change the WI etalon control filter parameters so it moves also from on/off regime to a linear control regime?

Images attached to this comment
Environmental Monitoring (Environmental Monitoring)
Tringali, Fiori, Gherardini - 17:49 Sunday 17 March 2024 (63649) Print this report
Environmental shift: far field magnetic injections WEB and NEB, test of automated injections using ENV_MAIN

We concluded the campaign of near field magnetic injections of elog 63540:

  • WE building - sweep 1-600Hz, 300s, 5V, 3 coil axes
  • NE building - (idem)
  • GPS times are reported in the attached log file.

We performed the full set of environmental injections by using the ENV_MAIN node (ITF was in LOW NOISE 3 SQZ)

  • start at about 14:30 UTC
  • CEB mag sweep (it lasted about 1800s, it seems ok)
  • NEB mag sweep  (issue: it seems that the NEB coil did not switch on)
  • WEB mag sweep  (issue: it seems that the WEB coil did not switch on)
  • CEB acoustic colored (issue: we could not overwrite the value written in the .ini file)
    • we still saw the extra noise at the start of the  colored injection (https://logbook.virgo-gw.eu/virgo/?r=62858) !! :-(
    • It seems that the reason is that the ENV_MAIN.py still points to the old executable from /virgoDev/EnvSweepts/v2r2/Linux-x86_64-CL7/.... it needs to be updated.

We tried to perform the "same" colored noise injections in CEB by using the "AcousticInjectionCEB" process in the VPM (pointing to the new executable /virgoApp/EnvSweepts/v2r1p1/... )

  • we tested different amplitudes for the noise: 1E-4  to 0.1 V/sqrtHz (Figure 1)
  • the extra noise is NOT present (!) good! (Figure 2)
  • it seems that when we set for example 0.01 the applied level is 10 times less (to be tested again)
  • when we set the volume at 0.1 we caused the ITF to unlock. Fabio observed that in particular the BS got very excited and it took a while to calm it (Figure 3)
  • However the level of noise seen by the microphone was not very loud: it was about a factor 10 above the quiet condition (Figure 2). This is about the same amount of noise injected in December without problems (see 62759)
  • The interferometer seems thus a bit more sensitive to acoustic noise in CEB. Might be due to the SQZ injections (LOW_NOISE_3_SQZ) ?

  Conclusion: we need to test again the ENV_MAIN after these fixings. About 1 hour is needed.

Images attached to this report
Non-image files attached to this report
Environmental Monitoring (Environmental Monitoring)
fiori, tringali, pasqualetti, gherardini, magazzù - 15:55 Sunday 17 March 2024 (63647) Print this report
Comment to Environmental shift - magnetic injection map, 25-min glitch investigation, new mysterious noise at NEB (63540)

"NE mysterious noise"

One additional event occurred March 16 at 22:23 UTC and caused an unlock: Figure 1 (trend), Figure 2 and Figure 3 (spectrogram of accelerometers). The frequency of the turbo pump line (547Hz) did not seem to be affected at all (Figure 4). 

At that time, according to Antonio's and Fabio's reports: the main turbo pump was switched off and the spare turbo pump was on, the accelerometer named ENV_NE_BOTTOM_ACC was placed on the main turbo (see picture in Figure 5).

Figure 6 compares the spectrum of this accelerometer (orange) with similar accelerometers on the NE big flange (blue) and on the NE cryo trap (green). The signal seen by the accelerometer on the main pump indeed  detected a large signal.

We moved the accelerometer named ENV_NE_MIDDLE_ACC on top of the spare turbo pump. See picture in Figure 7.

We switched off the external cooling fan of the main turbo.

Extra glitches in accelerometer ENV_NE_ACC_Z:  in Figure 2, we notice several fast glitches which are not seen by the other accelerometer. Need further investigation. 

Images attached to this comment
AdV-INJ (Baffles for INJ benches (SIB 1, SIB 2, EIB and IMC cavity))
derossi, tringali, gosselin, spinicelli, bulten - 17:53 Thursday 14 March 2024 (63611) Print this report
INJ noise hunting shift on scattered light - LB and EIB noise injections


Following the investigation in the entry #63491, this morning we perfomed a set of noise injections on both laser bench and external injection bench.
We started with the injection on laser bench by means of shaker installed few days ago #63577.

LB NOISE INJECTIONS
ITF locked

DAC channel: ENV_NOISE_CEB_EEroom

Freq. line 17.9 Hz, A=0.1 V, 09:59:55-10:13:57 UTCFreq. line 8 Hz, A=0.7 V, 10:37:20-10:42:46 UTCFreq. line 8 Hz, A=0.6 V, 10:50:58-10:57:20 UTCSecond part of the shift ITF unlocked (INJ standalone)Quiet = 15:35:00 (5’)  Freq. line 17.9 Hz, A=0.1 V, 15:40:20-15:48:00 UTCFreq. line 8 Hz, A=0.7 V, 15:49:51-15:58:36 UTCFreq. line 8 Hz, A=0.6 V, 16:00:04  - 16:06:01 UTCColored noise (1-15) Hz: 16:18:27  - 16:23:39 UTC

EIB NOISE INJECTIONS

ITF unlocked (INJ standalone)

(previous EIB injections #61713)

We injected a sine of 0.5Hz frequency (Henk Jan adjusted the cfg file to have the right amplitude by just enabling sine noise button)

gps start DOF amplitude duration
16:24:26 z 10 um 3 min
16:28:08 y - -
16:33:31 x - -
16:37:46 tx 10 urad -
16:41:26 ty - -
16:44:45 tz - -

The analysis of these injections will follow.

Environmental Monitoring (Environmental Monitoring)
Tringali, Fiori, De Rossi, Gosselin - 17:05 Tuesday 12 March 2024 (63577) Print this report
Shaker installation on laser bench

During the maintenance, we installed a shaker on the laser bench, see the attached Figures 1 and 2.
We checked the optimal parameter configuration to have the maximum displacement of the bench:

- freq. line injected at 17.9 Hz (laser bench horizontal resonance)
- voltage amplitude 0.1 V.

Looking at the episensor ENV_LB_SEIS_*, we achieved a spectral displacement of the laser bench at 17.9 Hz:

channel direction m s^{-2}/\sqrt{Hz} \mu m/\sqrt{Hz}
x  ~1e-2 ~0.8 
y ~1e-3 ~0.08
z ~4e-2 ~3.2

We checked that this injected line was not visible on EIB, Figure 3. 
We also tried to inject lines in the freq. range (1-5) Hz but the maximum displacement achieved was lower by a factor of ten.
 

Images attached to this report
Comments to this report:
derossi, spinicelli, tringali - 13:10 Thursday 04 April 2024 (63838) Print this report

On the March 12th, a shaker has been installed on the Laser Bench to perform sismic noise injection. After those studies done on the 14th, the electronics that controls the shaker (deployed on the ground) has been left ON (with 0V of input voltage) to have the possibility to further perform other remote injections. 
However, entering in the laser lab few days later, we noticed a slightly higher acoustic noise than usual. We decided then to switch OFF that electronics, and indeed the noise reduced.

Looking at the environmental sensors present in laser lab, we found this noise visible as both high frequency broad noise (>200Hz)  and with some lines a low frequency (~45Hz and harmonics).
Moreover, we see it on acoustic (see fig. 1-3, 5) and sismic (fig. 4) sensors. While the noise is visible on both benches, the effect (seismic and acoustic) on EIB is really faint (see fig 4-5).

Nevertheless, we didn't find any noticeble effect on Hrec.  

Images attached to this comment
Search Help
×

Warning

×